Component Structure
R2026bMetric ID
slcomp.ComponentStructure
Description
This metric returns structural information about the hierarchy within a software component. The metric analyzes how hierarchical elements, like subsystems, are nested inside a component.
Use this metric to help assess component complexity and maintainability. Components with deep nesting, wide branching, or unbalanced hierarchical structures can be more difficult to understand, modify, and maintain.
Supported Artifacts
You can collect this metric for Units and Components. To control what the dashboard classifies as a unit or component, see Categorize Models in Hierarchy as Components or Units.
Computation Details
The metric analyzes the structure of a component by representing the model hierarchy tree as a graph. In the graph:
Nodes are the elements in the hierarchy, such as block diagrams, subsystems, and other elements that define a hierarchy.
Edges connect a parent node to its child node, such as the connection between a block diagram and the subsystem that the block diagram contains
The metric evaluates the depth, size, and branching of the component by using these definitions:
Root — Top-level node of the component, such as a block diagram for a model or other elements that define a component boundary.
Leaf — Node that has no child nodes. Leaf nodes are endpoints in the component hierarchy.
Depth:
Minimum depth — Shortest path from the root node to any leaf node.
Maximum depth — Longest path from a node down to another node below it in the hierarchy.
Out-degree — Number of direct child nodes that a single node has.
Maximum out-degree — The largest number of direct children in any single node in the hierarchy.
For example, consider a component model with this structure:
Block Diagram
├─ Subsystem A
│  └─ Subsystem A1
└─ Subsystem B
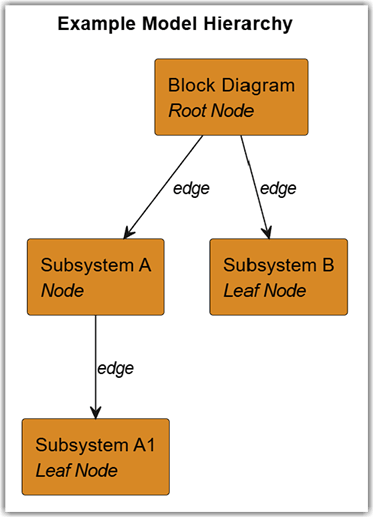
In this example hierarchy:
The block diagram and its subsystems are each nodes.
The block diagram is the root node.
Subsystem A1andSubsystem Bare leaf nodes.Each connection between a parent and child node is an edge.
For this example, the metric returns:
value =

  struct with fields:

        MaxDepth: 3
        MinDepth: 2
    MaxOutdegree: 2
           Nodes: 4
          Leaves: 2
           Edges: 3
Note
Nodes do not include elements that are only a reference, such as a model reference, subsystem reference, links to subsystem references, or blocks that reference a MATLAB® function, such as MATLAB System blocks.
Collection
To collect data for this metric, execute the metric engine with the metric ID.
metric_engine = metric.Engine;
results = execute(metric_engine,"slcomp.ComponentStructure")
Results
For this metric, instances of metric.Result return the
Value property as a structure with these fields:
MaxDepth— Longest path from a node down to another node below it in the hierarchy. A high value means there are parts of the hierarchy that are deeply nested, which can make the component more difficult to navigate.MinDepth— Shortest path from the root node to any leaf node. A large difference between minimum depth and maximum depth can indicate an unbalanced hierarchy.MaxOutdegree— Highest number of direct child nodes that any single node has. A high value means some parts of the component have many elements at the same level, creating a dense layer of the component.Nodes— Number of nodes in the component hierarchy. A high value indicates a large component.Leaves— Number of leaf nodes in the component hierarchy.Edges— Number of edges in the component hierarchy.

