Plot Lookup Tables
You can plot lookup table data specified for the PS Lookup Table (1D) and PS Lookup Table (2D) blocks in your model. Plotting the tables lets you visualize the data before simulating the model, to make sure that the table is correct. The plots reflect tabulated data specified for the block, as well as the selected interpolation and extrapolation options.
If you change the underlying table data, plotting it again opens a new window. This way, you can compare the plots side by side and see how the block parameter values affect the resulting lookup function.
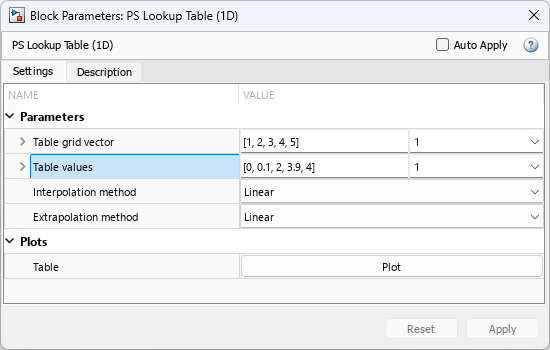
Create a new model and add a PS Lookup Table (1D) block. Specify the block parameters as shown.
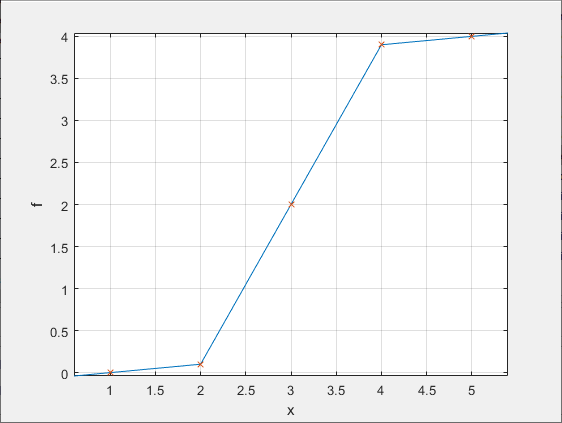
In the block dialog box, under Plots, click the Plot button next to Table.
A figure window containing the plot of the data opens.
In the block dialog box, change the Interpolation method parameter value to
Smooth.To plot the data again, click Plot.
A new figure window opens.
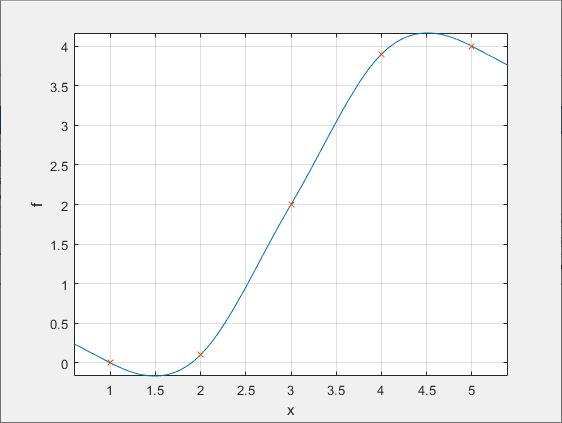
The curve shape has changed because of the new interpolation method.
In the block dialog box, change the Extrapolation method parameter value to
Nearest.To plot the data again, click Plot.
A new figure window opens.
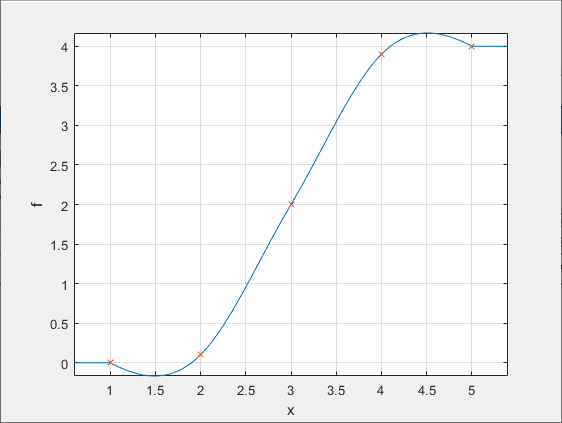
The curve shape within the table grid (between 1 and 5 along the x-axis) has not changed, but the new extrapolation method affects how the curve continues outside the specified range.
Note
If you change the Extrapolation method parameter value to
Error, there is no extrapolation region and the plot gets cut off at the first and last grid points.