Characterize Cell Thermal Runaway with Accelerating Rate Calorimetry (ARC) Test
This example shows how to characterize the thermal runaway behavior of a battery cell by simulating an accelerating rate calorimetry (ARC) test.
An ARC test is a technique that studies and characterizes the thermal behavior of batteries. To measure the heat generation rate and thermal stability, the test subjects the battery to controlled heating. This test helps to identify the conditions under which a battery can enter thermal runaway and provides valuable information for battery design, safety measures, and risk assessment.
With an ARC test, you can understand the thermal behavior of cells, including the onset temperature and the rate of heat release during a thermal runaway. This information is crucial to develop safer battery technologies and implement safety measures to prevent or mitigate the risks associated with thermal runaway.
A battery thermal runaway event is a self-reinforcing and uncontrolled exothermic reaction that factors, such as internal or external heat sources, electrical or mechanical abuses, manufacturing defects, or overcharging can trigger. When a thermal runaway occurs, the temperature of the battery rapidly increases. This rapid increase leads to a cascade of chemical reactions, an increase in heat generation, and the release of flammable gases.
This figure shows the stages of a thermal runaway event in an ARC test:

Model Overview
Open the CellThermalRunawayARC model.
modelName = "CellThermalRunawayARC";
open_system(modelName);
The system comprises an ARC Device subsystem and a Battery Cell block. The Battery Cell is an open circuit, which means it is disconnected from any electrical load.

Open the ARC Device subsystem. The ARC Device subsystem comprises the ARC Device Controller chart and the ARC Device Hardware subsystem. The hardware comprises a perfectly insulated box with a heater and a temperature sensor. The controller commands whether to apply heat or to enable cooldown.
open_system(strcat(modelName,'/ARC Device'));
Open the ARC Device Controller chart-
open_system(strcat(modelName,'/ARC Device/ARC Device Controller'));The ARC Device subsystem slowly heats the cell with a heat-wait-seek strategy until the battery starts to self-heat. Then, the device waits until the reaction is complete and commands a cooldown procedure.

Simulate ARC Test with Thermal Runaway Event
In this section, you add an exothermic reactions fault to the Battery Cell block. You then configure the fault and run the simulation to plot the temperature time series.
Add Exothermic Reactions Fault
Define the exothermic reactions fault. To ensure that exothermic reactions are active from the beginning of the simulation, set the TriggerType property to "Always on".
cellBlockName = "Battery Cell";
blockPath = strcat(modelName,'/',cellBlockName);
faultObj = getFaultObject(blockPath,"Exothermic reactions");
faultObj.Name = "ExothermicAlwaysOn";
faultObj.Description = strcat('Exothermic reactions with analytical model and no SOC tabulation. ', ...
    'Trigger is always on to allow the ARC Device to find the actual exothermic onset temperature');
faultObj.TriggerType = "Always On";
Configure Analytic Exothermic Reactions Fault
Set exothermic reaction parameters based on the electrochemical properties of the cell. Consult datasheets to customize the values for your own cell models. Select the analytical model without a dependency on the battery SOC.
setFaultParameter(faultObj,"ExothermModel","simscape.battery.enum.cells.ExothermModel.analytical"); setFaultParameter(faultObj,"TabulateWithSOC","0"); TotalHeatOfReactionJ =29000; % J ActivationEnergyJpmol =
135000; % J PercentThermalMassVented =
35; ExothermOnsetTemperatureK =
340; % K CurrentInterruptTemperatureK =
447; % K setFaultParameter(faultObj,"TotalHeatOfReaction",num2str(TotalHeatOfReactionJ)); setFaultParameter(faultObj,"ActivationEnergy",num2str(ActivationEnergyJpmol)); setFaultParameter(faultObj,"PercentThermalMassVented",num2str(PercentThermalMassVented)); setFaultParameter(faultObj,"ExothermOnsetTemperature",num2str(ExothermOnsetTemperatureK)); setFaultParameter(faultObj,"CurrentInterruptTemperature",num2str(CurrentInterruptTemperatureK));
Run Analytical Exothermic Reactions Fault Simulation
Enable the fault and run the simulation.
faultObj.activate;
out = sim(modelName);
simlog1 = out.simlog_CellThermalRunawayARC;
Plot Simulation Results
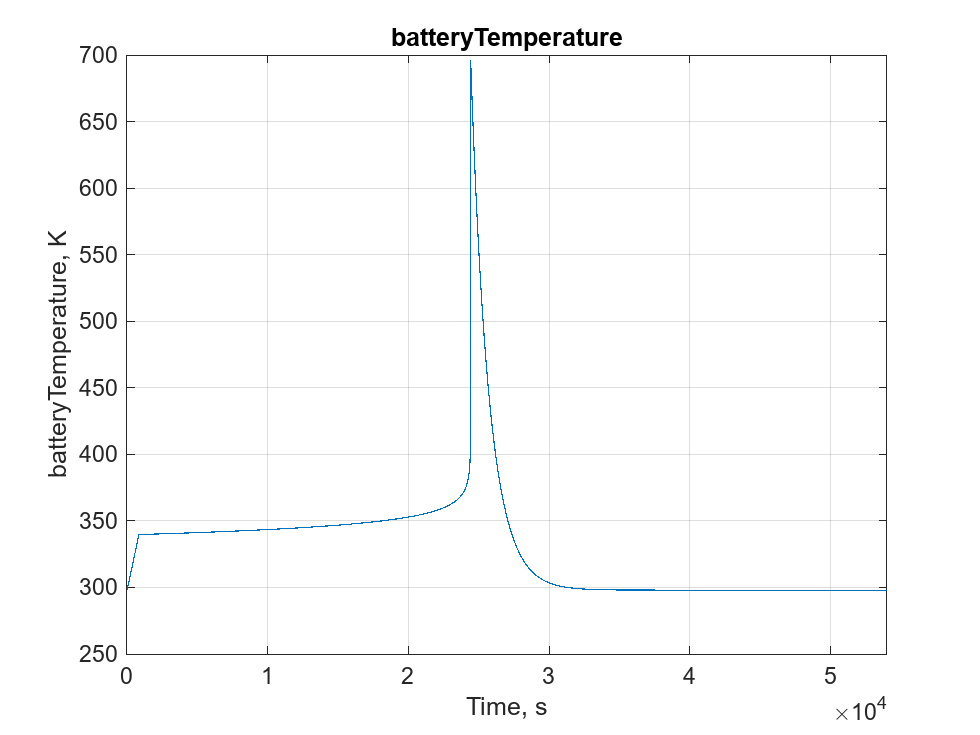
Plot the battery temperature.
Tcell = simlog1.Battery_Cell.batteryTemperature;
reactionExtent = simlog1.Battery_Cell.reactionExtent;
plot(Tcell)
ans = struct with fields:
          id: [1×1 Figure]
    childIds: []
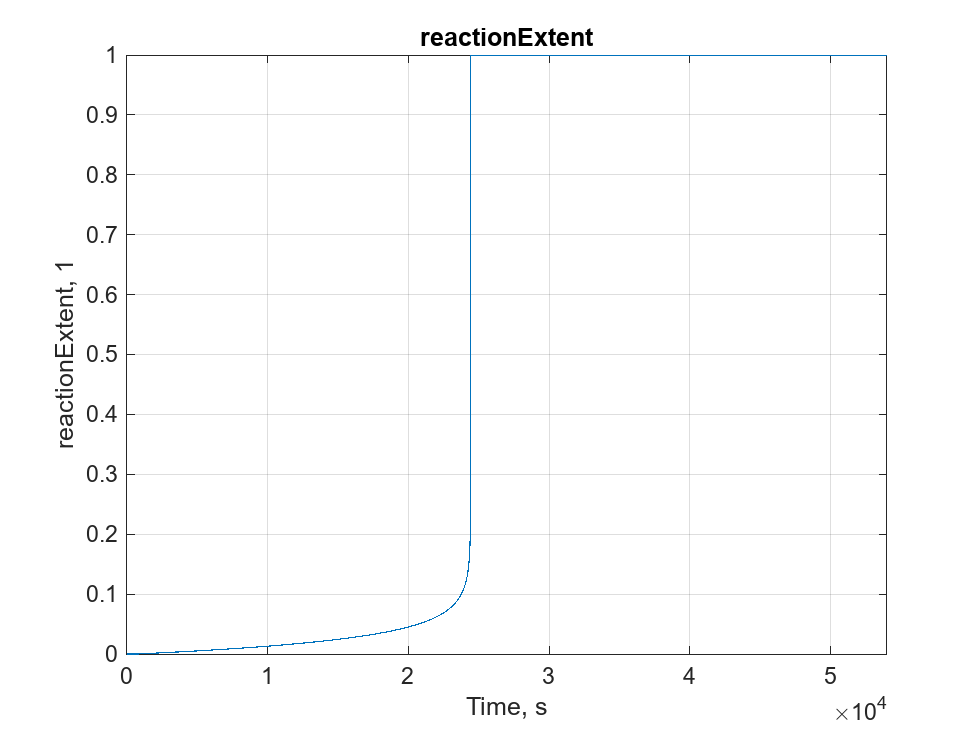
Plot the extent of the reaction.
plot(reactionExtent)

ans = struct with fields:
          id: [1×1 Figure]
    childIds: []
Characterize Cell Exothermic Reactions
You can use ARC tests to experimentally determine the temperature rate as a function of the temperature during a self-heating thermal runaway event. If you have experimental data, load it and plot it in this section.
Use the simulation results of the analytical thermal runaway model as the experimental measurement results.
[TcellSH,dTdtSH] = extractTemperatureDuringSelfHeating(simlog1);
plot(TcellSH,dTdtSH,"r*")
grid on
title("Temperature Rate as Function of Temperature")
xlabel("Cell Temperature (K)")
ylabel("dTdt (K/s)")
Configure Data-Driven Exothermic Reactions Model with Table Lookups
Use the simulation data to parameterize a data-driven exothermic reactions model. Select the tabulated ARC test temperature rate and do not model the dependency with SOC.
setFaultParameter(faultObj,"ExothermModel","simscape.battery.enum.cells.ExothermModel.acceleratedRateCalorimetryTemperature"); % select Tabulated ARC test temperature rate
setFaultParameter(faultObj,"TabulateWithSOC","0"); % do not model dependency with SOC in this case
setFaultParameter(faultObj,"TemperaturesFromARC",mat2str(TcellSH));
setFaultParameter(faultObj,"TemperatureRatesFromARC",mat2str(dTdtSH));
faultObj.TriggerType = "Behavioral"; % Use Temperature-based trigger.
faultObj.BehavioralTriggerData.TriggerTemperature.value = num2str(ExothermOnsetTemperatureK); % Set trigger temperature
Run Data-Driven Exothermic Reactions Fault Simulation
Enable the fault and run the data-driven simulation.
faultObj.activate;
out = sim(modelName);

simlog2 = out.simlog_CellThermalRunawayARC;
Plot Simulation Results
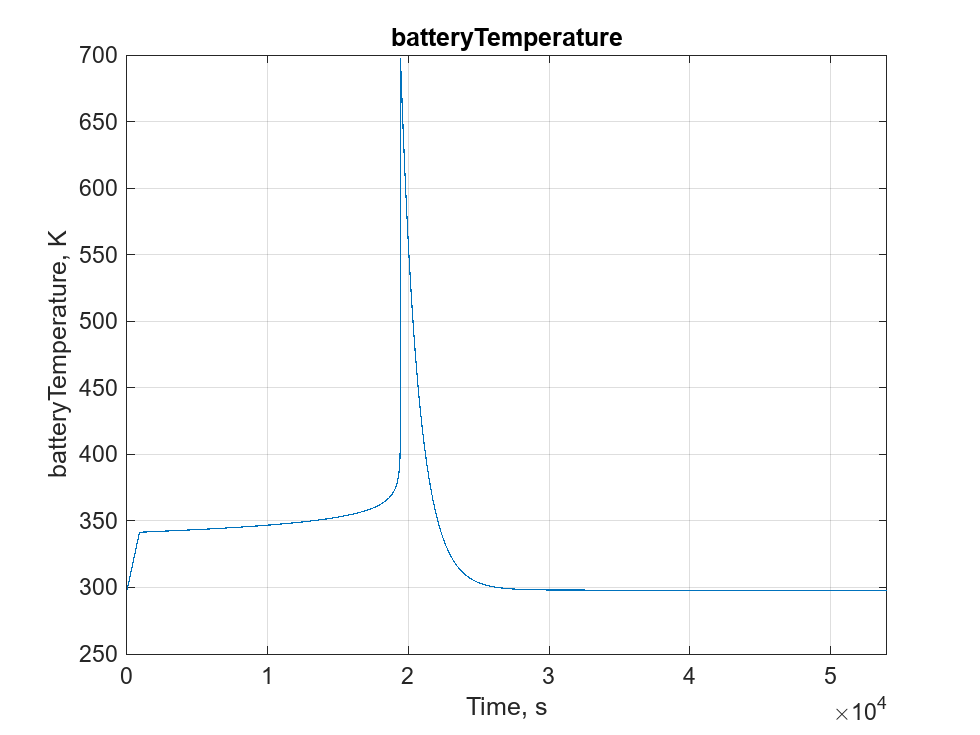
Plot the battery temperature.
Tcell = simlog2.Battery_Cell.batteryTemperature;
reactionExtent = simlog2.Battery_Cell.reactionExtent;
plot(Tcell)
ans = struct with fields:
          id: [1×1 Figure]
    childIds: []
Plot the extent of the reaction.
plot(reactionExtent)

ans = struct with fields:
          id: [1×1 Figure]
    childIds: []
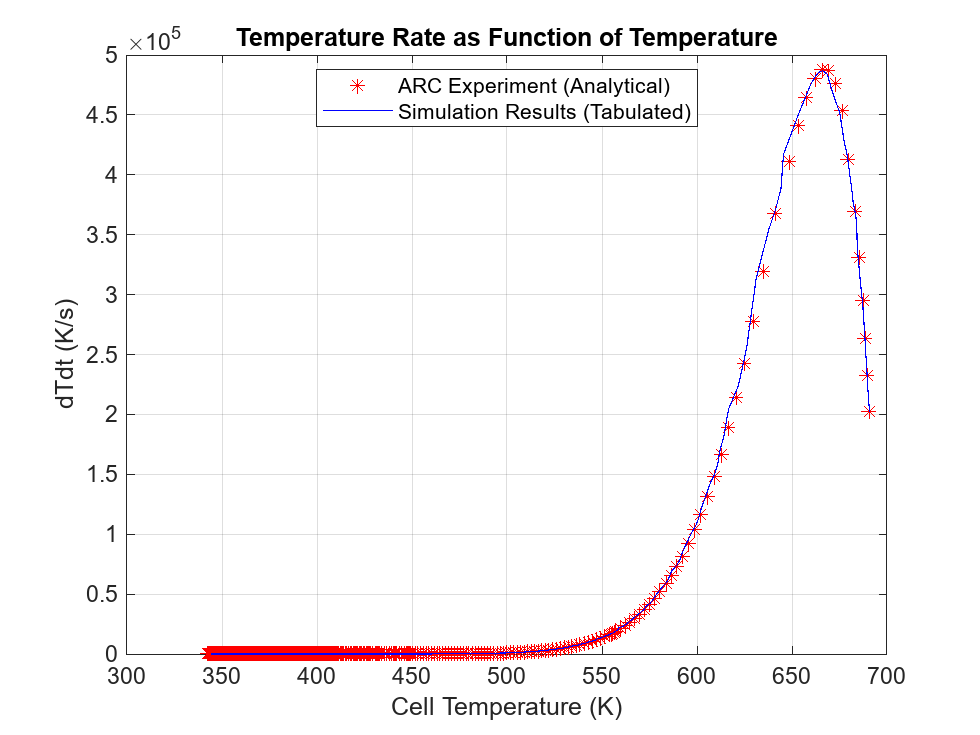
Validate Exothermic Reactions Characterization
Compare the measured temperature rate with the simulated temperature rate from the data-driven exothermic reactions model. The ARC experiment data and the simulation results from the table lookup model match closely.
[simTcellSH,simdTdtSH] = extractTemperatureDuringSelfHeating(simlog2);
figure
plot(TcellSH,dTdtSH,"r*")
hold on
plot(simTcellSH,simdTdtSH,"b")
grid on
title("Temperature Rate as Function of Temperature")
xlabel("Cell Temperature (K)")
ylabel("dTdt (K/s)")
legend({"ARC Experiment (Analytical)","Simulation Results (Tabulated)"},Location="best")

Observe a good fit between the ARC experiment data and the simulation results from the table lookup model.
Supporting Function
function [TcellSH, dTdtSH] = extractTemperatureDuringSelfHeating(simlog)
    % Returns temperature and temperature-rate vectors during self-heating
    tvec = simlog.Battery_Cell.batteryTemperature.series.time;
    Tcell = simlog.Battery_Cell.batteryTemperature.series.values("K");
    reactionExtent = simlog.Battery_Cell.reactionExtent.series.values;
    selfHeating = reactionExtent > 0.01 & reactionExtent < 0.99;
    TcellSH = Tcell(selfHeating);
    dTdtSH = diff(TcellSH)./diff(tvec(selfHeating));
    TcellSH(end) = []; % to have the same length as dTdtSH
end