SimEvents Debugger
Debug SimEvents models
Libraries:
SimEvents
Description
The SimEvents Debugger block enables the debugger for your SimEvents® model. Using this block, you can:
Inspect entities and their attribute values in storage blocks
Set breakpoints on blocks and events
Watch entities
Note
The SimEvents debugger is a preliminary version.
To start debugging your model:
From the SimEvents Library, add the SimEvents Debugger block into your SimEvents model.
In the Simulink® Editor, click the Step Forward button.
The debugger interface appears.
Click the Continue simulation button (
 ) to begin the simulation in the debugger. When the
simulation completes, the debugger interface closes.
) to begin the simulation in the debugger. When the
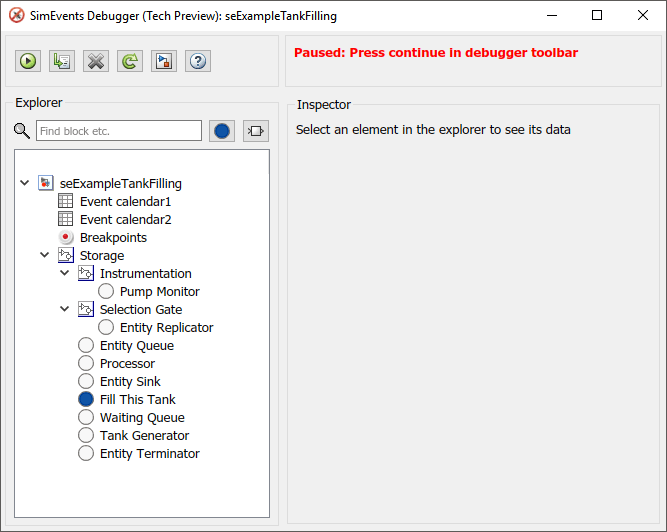
simulation completes, the debugger interface closes.To explore their data and behavior, the model tree displays in the left pane. Select the elements in the tree.
When done, on the Simulink editor, click the Stop button to stop the simulation.
Inspect Entities
To inspect entities in the debugger:
To step to the next time step and inspect entities, in the Simulink editor, click the Step Forward button again. This action skips over all events at
tnow.To step to the next event and inspect entities, in the debugger, click
 .
.To set a breakpoint:
At a particular time, use the Simulation Stepper to set breakpoints.
At an event on the event calendar, in the debugger, in the left pane, click an event calendar.
At every event, in the debugger, in the left pane, select the event calendar. In the Event Calendar Events pane, select the Break before event execution check box.
When an entity enters a block, in the debugger, select the block. At the bottom of the Inspector pane, select the Break upon entry check box.
When an entity leaves a block, in the debugger, select the block. At the bottom of the Inspector pane, select the Break prior to entity exit check box.
To go to a breakpoint, in the debugger, click the Continue button (
).Note
When you stop the debugger at a breakpoint, the Simulink editor and the MATLAB® Command Window appear unresponsive. However, you can inspect entities, set new breakpoints, and continue the simulation from the debugger window.
To watch entities, in the left tree, click the block. In the Inspector pane, select the check box of the entity you want to watch.
Parameters
Version History
Introduced in R2016a