Find Periodicity Using Autocorrelation
Measurement uncertainty and noise sometimes make it difficult to spot oscillatory behavior in a signal, even if such behavior is expected.
The autocorrelation sequence of a periodic signal has the same cyclic characteristics as the signal itself. Thus, autocorrelation can help verify the presence of cycles and determine their durations.
Consider a set of temperature data collected by a thermometer inside an office building. The device takes a reading every half hour for four months. Load the data and plot it. Subtract the mean to concentrate on temperature fluctuations. Convert the temperature to degrees Celsius. Measure time in days. The sample rate is thus 2 measurements/hour × 24 hours/day = 48 measurements/day.
load officetemp

tempC = (temp-32)*5/9;

tempnorm = tempC-mean(tempC);

fs = 2*24;
t = (0:length(tempnorm) - 1)/fs;

plot(t,tempnorm)
xlabel('Time (days)')
ylabel('Temperature ( {}^\circC )')
axis tight
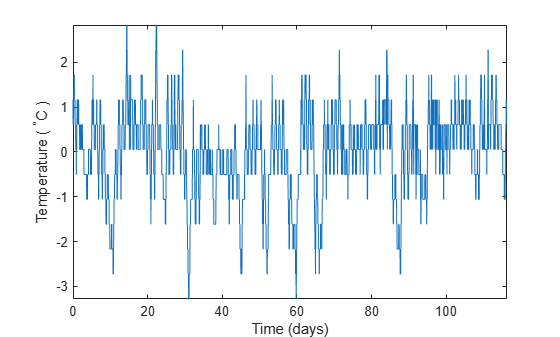
The temperature does seem to oscillate, but the lengths of the cycles cannot be read out easily.
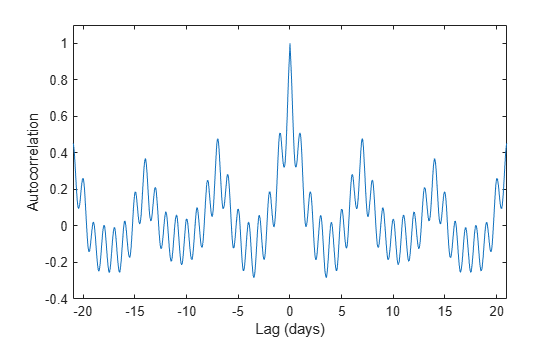
Compute the autocorrelation of the temperature such that it is unity at zero lag. Restrict the positive and negative lags to three weeks. Note the double periodicity of the signal.
[autocor,lags] = xcorr(tempnorm,3*7*fs,'coeff');

plot(lags/fs,autocor)
xlabel('Lag (days)')
ylabel('Autocorrelation')
axis([-21 21 -0.4 1.1])
Determine the short and long periods by finding the peak locations and determining the average time differences between them.
To find the long period, restrict findpeaks to look for peaks separated by more than the short period and with a minimum height of 0.3.
[pksh,lcsh] = findpeaks(autocor);
short = mean(diff(lcsh))/fs
short =
1.0021
[pklg,lclg] = findpeaks(autocor, ...
    'MinPeakDistance',ceil(short)*fs,'MinPeakheight',0.3);
long = mean(diff(lclg))/fs
long =
6.9896
hold on
pks = plot(lags(lcsh)/fs,pksh,'or', ...
    lags(lclg)/fs,pklg+0.05,'vk');
hold off
legend(pks,[repmat('Period: ',[2 1]) num2str([short;long],0)])
axis([-21 21 -0.4 1.1])
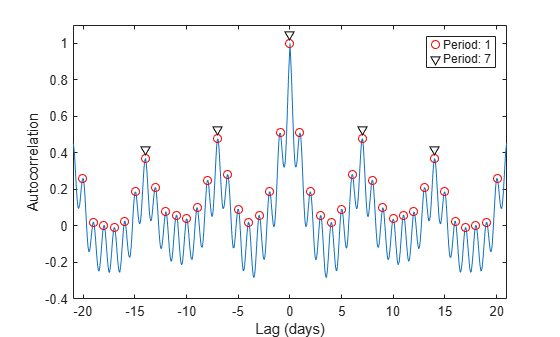
To a very good approximation, the autocorrelation oscillates both daily and weekly. This is to be expected, since the temperature in the building is higher when people are at work and lower at nights and on weekends.