dspdata.psd
Power spectral density
Syntax
Hpsd = dspdata.psd(Data)

Hpsd = dspdata.psd(Data,Frequencies)

Hpsd = dspdata.psd(...,'Fs',Fs)

Hpsd = dspdata.psd(...,'SpectrumType',SpectrumType)

Hpsd = dspdata.psd(...,'CenterDC',flag)
Description
Note
The use of dspdata.psd is not recommended.
Use pburg, pcov, periodogram, pmcov, pmtm, pwelch, or pyulear instead.
The power spectral density (PSD) is intended for continuous
spectra. The integral of the PSD over a given frequency band computes
the average power in the signal over that frequency band. In contrast
to the mean-squared spectrum, the peaks in this spectra do not reflect
the power at a given frequency. See the avgpower method
of dspdata for more information.
A one-sided PSD contains the total power of the signal in the frequency interval from DC to half of the Nyquist rate. A two-sided PSD contains the total power in the frequency interval from DC to the Nyquist rate.
Hpsd = dspdata.psd(Data) uses
the power spectral density data contained in Data,
which can be in the form of a vector or a matrix, where each column
is a separate set of data. Default values for other properties of
the object are shown below:
Property | Default Value | Description |
|---|---|---|
|
| Read-only character vector |
|
type | Vector of frequencies at which the power spectral density
is evaluated. The range of this vector depends on the If
you do not specify If The
length of the |
|
| Sampling frequency, which is |
|
| Nyquist interval over which the power spectral density
is calculated. Valid values are The range for half the Nyquist interval is [0 pi) or [0 pi] depending on the number of FFT points. For the whole Nyquist interval, the range is [0 2pi). |
|
| Whether the frequency is normalized ( |
Hpsd = dspdata.psd(Data,Frequencies) uses
the power spectral density estimation data contained in Data and Frequencies vectors.
Hpsd = dspdata.psd(...,'Fs',Fs) uses
the sampling frequency Fs. Specifying Fs uses
a default set of linear frequencies (in Hz) based
on Fs and sets NormalizedFrequency to false.
Hpsd = dspdata.psd(...,'SpectrumType',SpectrumType) specifies
the interval over which the power spectral density is calculated.
For data that ranges from [0 π)
or [0 π], set the SpectrumType to onesided;
for data that ranges from [0 2π),
set the SpectrumType to twosided.
Hpsd = dspdata.psd(...,'CenterDC',flag) uses
the value of flag to indicate whether the zero-frequency
(DC) component is centered. If flag is true,
it indicates that the DC component is in the center of the two-sided
spectrum. Set the flag to false if
the DC component is on the left edge of the spectrum.
Methods
Methods provide ways of performing functions directly on your dspdata object.
You can apply a method directly on the variable you assigned to your dspdata.psd object.
You can use the following methods with a dspdata.psd object.
avgpowercenterdcnormalizefreqonesidedplottwosided
For example, to normalize the frequency and set the NormalizedFrequency parameter
to true, use
Hpsd = normalizefreq(Hpsd)
For detailed information on using the methods and plotting the
spectrum, see the dspdata reference
page.
Examples
Estimate the one-sided power spectral density of a noisy sinusoidal signal with two frequency components.
Fs = 32e3;
t = 0:1/Fs:2.96;
x = cos(2*pi*t*1.24e3)+ cos(2*pi*t*10e3)+ randn(size(t));
nfft = 2^nextpow2(length(x));
Pxx = abs(fft(x,nfft)).^2/length(x)/Fs;
Store the spectrum in a PSD data object and plot the result.
Hpsd = dspdata.psd(Pxx(1:length(Pxx)/2),'Fs',Fs);
plot(Hpsd)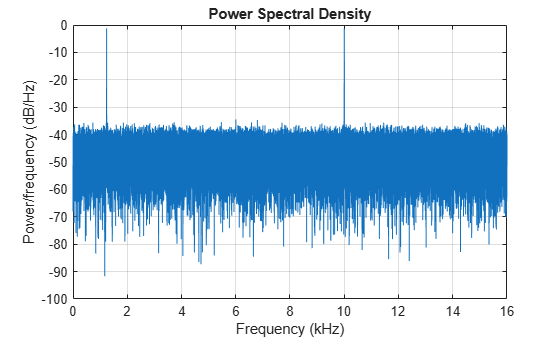
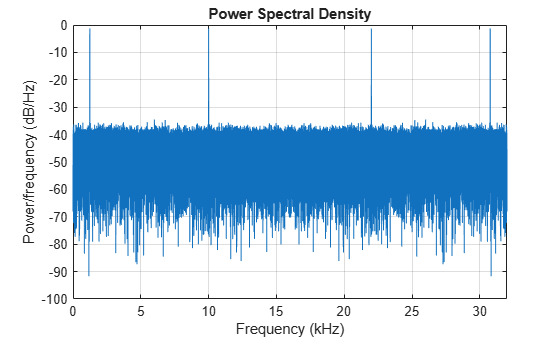
Create a two-sided spectrum and plot it.
Hpsd = dspdata.psd(Pxx,'Fs',Fs,'SpectrumType','twosided');
plot(Hpsd)
Version History
Introduced before R2006a