Create Simulink Report Generator Reports
The Simulink® Report Generator™ Report API comprises objects that find and format model and simulation data. You can use these objects with MATLAB® Report API and DOM API objects to create MATLAB programs that generate reports on Simulink models and simulations. This example shows how to use the Simulink Report API and the MATLAB Report API to create a MATLAB program. This program generates a report on the contents of a Simulink model. The report contains these sections:
Title Page
Table of Contents
Root System Chapter — Contains the root block diagram and properties of each block in the root diagram.
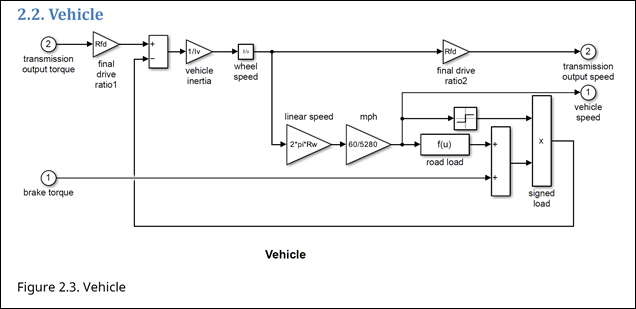
Subsystems Chapter — Contains the diagram and block properties of each subsystem of the model.
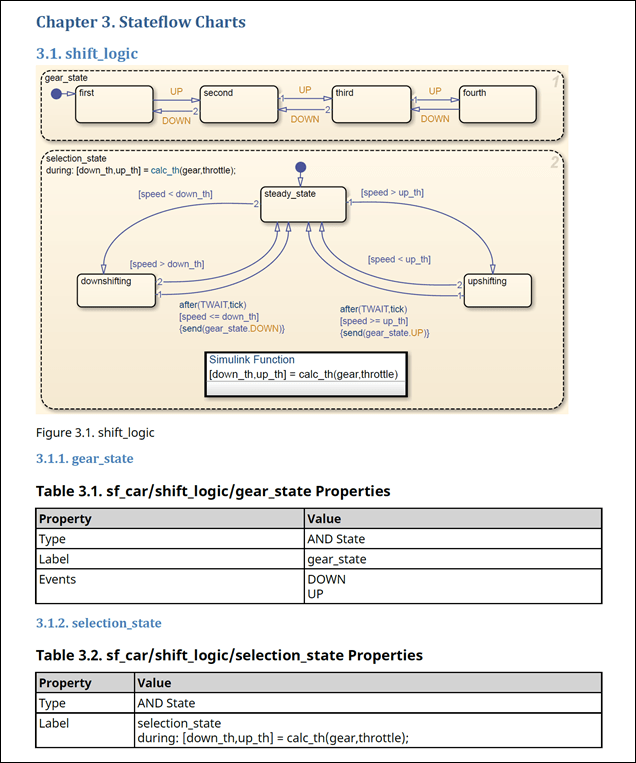
Stateflow® Charts Chapter — Contains charts and chart object properties of each chart in the model.
Create Report
To eliminate the need to use fully qualified names of the Report, Finder, and DOM API functions, use these statements. For example, instead of using slreportgen.finder.BlockFinder, you can use BlockFinder.
import slreportgen.report.*
import slreportgen.finder.*
import mlreportgen.report.*
Load the sf_car model.
model = load_system("sf_car");Use the Simulink report constructor, slreportgen.report.Report, to create a report object to hold the contents of the report. You must fully qualify the name of the constructor to distinguish it from the MATLAB report constructor, mlreportgen.report.Report. Set the name of the report to sdd_ followed by the value of the Name property of the model.
rpt = slreportgen.report.Report("sdd_" + get_param(model,"Name"),"pdf");
Add Title Page
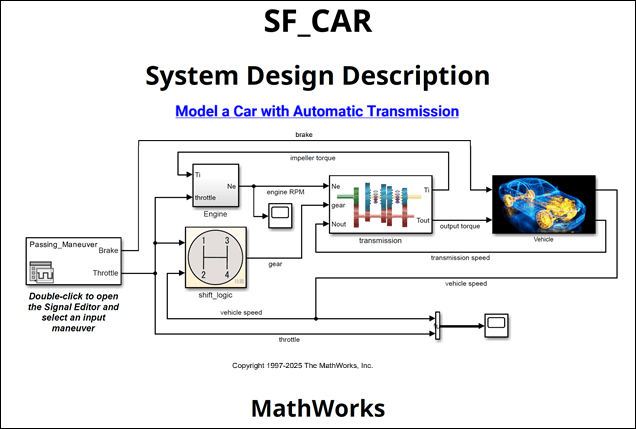
Use the title page reporter constructor, mlreportgen.report.TitlePage, to create a title page. Set the Title, Subtitle, and Author properties to character arrays that specify the report title, subtitle, and author, respectively.
Use the diagram reporter constructor, slreportgen.report.Diagram, to create a diagram snapshot of the model. This reporter generates an image of the block diagram of the model. To include this image on the report title page, assign the diagram reporter to the Image property of the title page reporter. Then, add the title page to the report.
tp = TitlePage;
tp.Title = upper(get_param(model,"Name"));
tp.Subtitle = "System Design Description";
tp.Author = "MathWorks";
tp.Image = Diagram(model);
append(rpt,tp);
Add Table of Contents
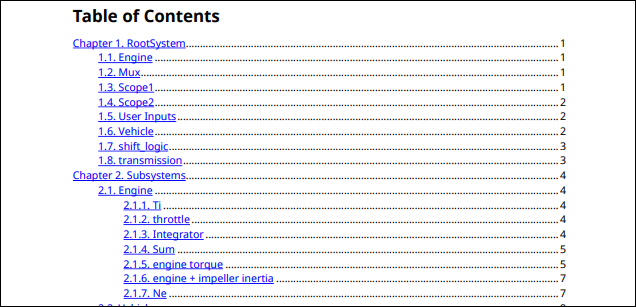
Use the table of contents reporter constructor, mlreportgen.report.TableOfContents, to create a table of contents for the report. Add the table of contents reporter to the report.
toc = TableOfContents;
append(rpt,toc);
Add Chapter for Root System
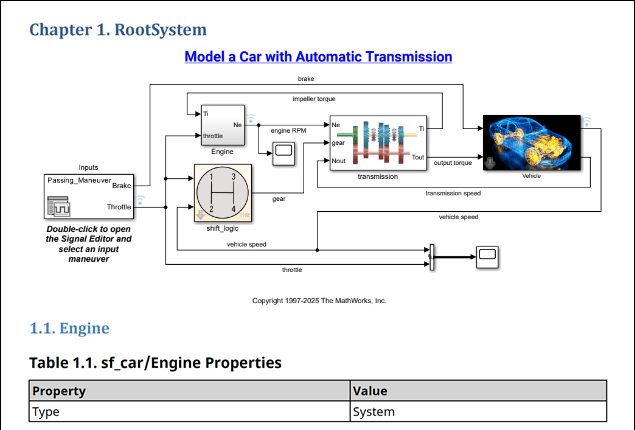
Use the chapter constructor, mlreportgen.report.Chapter, to create a chapter based on the Title and Content properties. The reporter numbers the chapter title and generates the chapter page headers, footers, and page numbers.
Add a model diagram reporter to the chapter. This reporter returns an image of the block diagram that you add to the chapter.
ch = Chapter("Title","RootSystem");
append(ch,Diagram(model));
Add Chapter for Each Block in Root System
Use the block finder constructor, slreportgen.finder.BlockFinder, to create a block finder for the root diagram. Then, use the find method to return an array of slreportgen.finder.BlockResult objects, each of which contains a block.
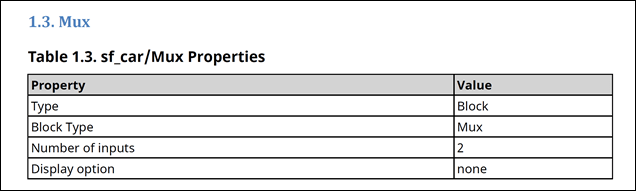
Loop through the block result objects. For each result, construct a section reporter, mlreportgen.report.Section, to generate a numbered report section. Set the section Title property to the name of the block on which it reports.
Add the current block result to the section reporter to set the section reporter Content property to a slreportgen.report.SimulinkObjectProperties reporter. This reporter generates a table of the properties of the current block and adds it to the section. Add each subsection to the parent chapter. Then, add the chapter to the report.
blkFinder = BlockFinder(model);
blocks = find(blkFinder);
for block = blocks
    section = Section("Title", ...
       strrep(block.Name,newline," "));
    append(section,block);
    append(ch,section);
end
append(rpt,ch);
Add Chapter for Subsystems
Create a chapter for the subsystems in the model and the blocks in each subsystem.
ch = Chapter("Title","Subsystems");
Find the subsystems in the model. The system diagram finder slreportgen.finder.SystemDiagramFinder returns an array of slreportgen.finder.DiagramResult objects, each of which contains a Diagram reporter that creates a snapshot of a subsystem.
sysdiagFinder = SystemDiagramFinder(model);
sysdiagFinder.IncludeRoot = false;
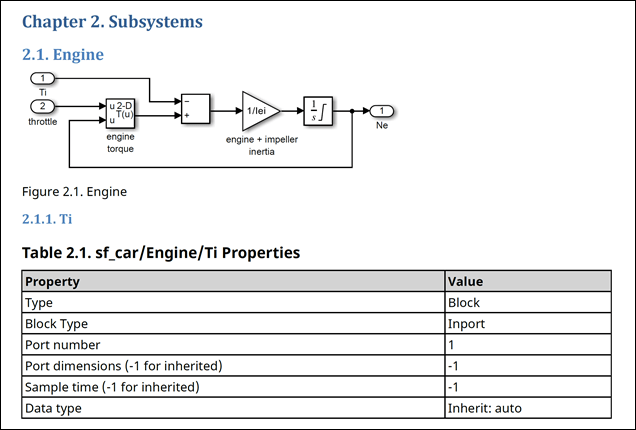
Use a while loop to create a chapter section for each subsystem. Find the blocks and block elements in each subsystem. Add a table of block elements to each chapter section and add each section to the chapter. Then, add the chapter to the report.
while hasNext(sysdiagFinder)
    system = next(sysdiagFinder);
    section1 = Section("Title",system.Name);
    append(section1,system);

    blkFinder1 = BlockFinder(system);
    elems = find(blkFinder1);
    for elem = elems
       section2 = Section("Title",...
           strrep(elem.Name,newline," "));
       append(section2,elem);
       append(section1,section2);
    end
    append(ch,section1);
end
append(rpt,ch);
Add Chapter for Stateflow Charts and Objects
Create a chapter. Find the Stateflow charts in the model by using the chart finder, slreportgen.finder.ChartDiagramFinder. Use a while loop to add subsections for each chart. Use the diagram element finder slreportgen.finder.StateflowDiagramElementFinder to find the elements in each chart and add them to the subsections. Then, add the section to the chapter and the chapter to the report.
ch = Chapter("Title", "Stateflow Charts");

chdiagFinder = ChartDiagramFinder(model);
while hasNext(chdiagFinder)
   chart = next(chdiagFinder);
   section = Section("Title",chart.Name);
   append(section,chart);

   objFinder = StateflowDiagramElementFinder(chart);
   sfObjects = find(objFinder);
   for sfObj = sfObjects
       title = sfObj.Name;
       if isempty(title)
          title = sfObj.Type;
       end
       objSection = Section("Title",title);
       append(objSection,sfObj);
       append(section,objSection);
   end
   append(ch,section);
end
append(rpt,ch);
Generate Report
Close the report, run the report, and close the model.
close(rpt);
rptview(rpt);
close_system(model);