Robustness and Worst-Case Analysis
In robust control design, performance is expressed and measured in terms of the peak gain (the H∞ norm or peak singular value) of a system. The smaller this gain is, the better the system performance. The performance of a nominally stable uncertain system generally degrades as the amount of uncertainty increases. Use robustness analysis and worst-case analysis to examine how the amount of uncertainty in your system affects the stability and peak gain of the system.
Robustness Analysis
Robustness analysis is about finding the maximum amount of uncertainty compatible with stability or with a given performance level. The following illustration shows a typical tradeoff curve between performance and robustness. Here, the peak gain (peak magnitude on a Bode plot or singular-value plot) characterizes the system performance.

The x-axis quantifies the normalized amount of uncertainty. The
value x = 1 corresponds to the uncertainty ranges specified in
the model. x = 2 represents the system with twice as much
uncertainty. x = 0 corresponds to the nominal system. (See
actual2normalized for more details
about normalized uncertainty ranges.) The y-axis is performance,
measured as the peak gain of some closed-loop transfer function. For instance, if
the closed-loop transfer function measures the sensitivity of an error signal to
some disturbance, then higher peak gain corresponds to poorer disturbance
rejection.
When all uncertain elements are set to their nominal values (x = 0), the gain of the system is its nominal value. In the figure, the nominal system gain is about 1. As the range of values that the uncertain elements can take increases, the peak gain over the uncertainty range increases. The heavy blue line represents the peak gain, and is called the system performance degradation curve. It increases monotonically as a function of the uncertainty amount.
Robust Stability Margin
The system performance degradation curve typically has a vertical asymptote
corresponding to the robust stability margin. This margin
is the maximum amount of uncertainty that the system can tolerate while
remaining stable. For the system of the previous illustration, the peak gain
becomes infinite at around x = 2.3. In other words, the
system becomes unstable when the uncertainty range is 2.3 times that specified
in the model (in normalized units). Therefore, the robust stability margin is
2.3. To compute the robust stability margin for an uncertain system model, use
the robstab function.
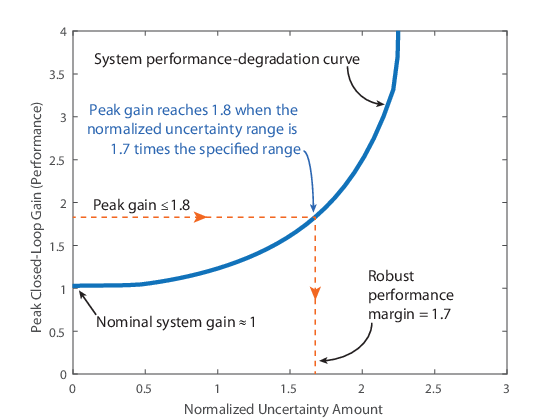
Robust Performance Margin
The robust performance margin for a given gain, γ, is the maximum amount of uncertainty the system can tolerate while having a peak gain less than γ. For example, in the following illustration, suppose that you want to keep the peak closed-loop gain below 1.8. For that peak gain, the robust performance margin is about 1.7. This value means that the peak gain of the system remains below 1.8 as long as the uncertainty remains within 1.7 times the specified uncertainty (in normalized units).
To compute the robust performance margin for an uncertain system model, use
the robgain function.
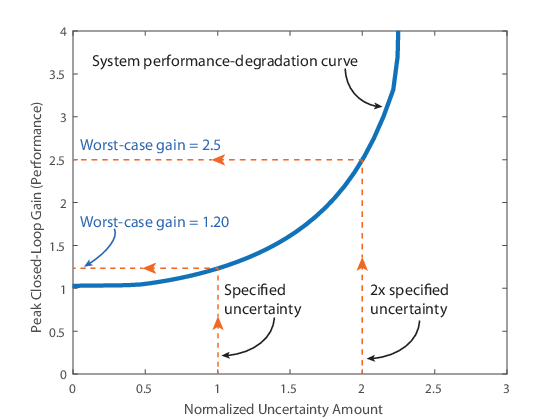
Worst-Case Gain Measure
The worst-case gain is the largest value that the peak gain can take over a specific uncertainty range. This value is the counterpart of the robust performance margin. While the robust performance margin measures the maximum amount of uncertainty compatible with a particular peak gain level, the worst-case gain measures the maximum gain associated with a particular uncertainty amount. For instance, in the following illustration, the worst-case gain for the uncertainty amount specified in the model is about 1.20. If that uncertainty amount is doubled, the worst-case gain increases to 2.5.
To compute the worst-case gain for an uncertain system model, use the wcgain function. The
ULevel option of the wcOptions command lets you compute
the worst-case gain for different amounts of uncertainty.