Neyman-Pearson Hypothesis Testing
Purpose of Hypothesis Testing
In phased-array applications, you sometimes need to decide between two competing hypotheses to determine the reality underlying the data the array receives. For example, suppose one hypothesis, called the null hypothesis, states that the observed data consists of noise only. Suppose another hypothesis, called the alternative hypothesis, states that the observed data consists of a deterministic signal plus noise. To decide, you must formulate a decision rule that uses specified criteria to choose between the two hypotheses.
Support for Neyman-Pearson Hypothesis Testing
When you use Phased Array System Toolbox™ software for applications such as radar and sonar, you typically use the Neyman-Pearson (NP) optimality criterion to formulate your hypothesis test.
When you choose the NP criterion, you can use npwgnthresh to determine the threshold
for the detection of deterministic signals in white Gaussian noise.
The optimal decision rule derives from a likelihood ratio
test (LRT). An LRT chooses between the null and alternative
hypotheses based on a ratio of conditional probabilities.
npwgnthresh enables you to specify the
maximum false-alarm probability as a constraint. A false
alarm means determining that the data consists of a signal
plus noise, when only noise is present.
For details about the statistical assumptions the npwgnthresh function
makes, see the reference page for that function.
False Alarm Rate for Real-Valued Signal in White Gaussian Noise
This example shows how to empirically compute the probability of false alarm for real-valued data in white Gaussian noise.
Determine the required signal-to-noise ratio (SNR) in decibels for the NP detector (also known as the LRT detector) when the maximum tolerable false-alarm probability is .
% Probability of false alarm
pfa = 1e-3;

% SNR threshold in dB
snrThdB = npwgnthresh(pfa,1,'real');

% SNR threshold
snrThNP = sqrt(db2pow(snrThdB));
Assume the variance is 2 and generate 1 million samples of real Gaussian noise under the null hypothesis.
rng default

% Noise variance
variance = 2;

% Number of independent samples
M = 1e6;

% Data under null hypothesis
x = sqrt(variance) * randn(1,M);
Verify empirically that the detection threshold results in the desired false-alarm rate under the null hypothesis. This can be verified by determining the proportion of normalized samples that exceed the required SNR threshold.
% Empirical false-alarm rate
falseAlarmRateNP = sum(x/sqrt(variance) > snrThNP)/M
falseAlarmRateNP = 9.9500e-04
Alternatively, use phased.LRTDetector to empirically calculate the detection result and false alarm rate. The LRT detector requires inputting the noise-free signal under the alternative hypothesis. As we test the null hypothesis, the amplitude of the noise-free signal under the alternative hypothesis is irrelevant to the testing and can be set to any real value. Set the noise-free signal under the alternative hypothesis to be 10.
% Configure the LRT detector lrt = phased.LRTDetector('DataComplexity','Real',... 'ProbabilityFalseAlarm',pfa,'ThresholdOutputPort',true); % Known noise-free signal under the alternative hypothesis xnoisefree = 10; % LRT detection [dresult,stat,snrThLRT] = lrt(x,xnoisefree,variance); % Empirical false-alarm rate falseAlarmRateLRT = sum(dresult)/M
falseAlarmRateLRT = 9.9500e-04
The false alarm rates estimated using the above two methods are consistent.
% Difference between SNR thresholds calculated by npwgnthresh and LRT detector
thmse = abs(snrThNP-snrThLRT)^2thmse = 1.9722e-31
The SNR thresholds generated from npwgnthresh and phased.LRTDetector are also consistent.
Plot the first 10,000 samples of detection statistics. The red horizontal line shows the detection threshold of the LRT detector. The yellow circle shows the detected false alarm.
% Plot detection statistics x1 = stat(1:1e4); plot(x1) % Plot detection threshold line([1 length(x1)],[snrThLRT snrThLRT],'Color','red') hold on % Plot detection results dindex = find(dresult(1:1e4)); plot(dindex,stat(dindex),'o'); xlabel('Sample') ylabel('Value')
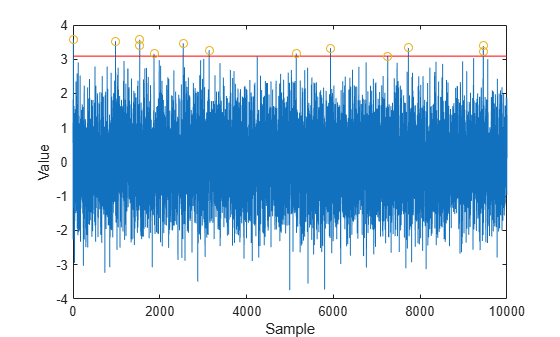
You can see that few sample values exceed the threshold. This result is expected because of the low false-alarm probability.
False Alarm Rate for Two Pulses of Real-Valued Signal in White Gaussian Noise
This example shows how to empirically verify the probability of false alarm in a system that integrates two real-valued pulses. In this scenario, each integrated sample is the sum of two samples, one from each pulse.
Determine the required SNR for the NP detector (the LRT detector) when the maximum tolerable false-alarm probability is .
% Probability of false alarm pfa = 1e-3; % SNR threshold in dB snrThdB = npwgnthresh(pfa,2,'real'); % SNR threshold snrThNP = sqrt(db2pow(snrThdB));
Generate two sets of 1 million samples of a real Gaussian noise under the null hypothesis.
rng default % Noise variance variance = 5; % Number of independent samples M = 1e6; % Two pulses pulse1 = sqrt(variance)*randn(1,M); pulse2 = sqrt(variance)*randn(1,M); % Integration of two pulses intpuls = pulse1 + pulse2;
Compute the proportion of normalized samples that exceed the threshold.
% Empirical false-alarm rate
falseAlarmRateNP = sum(intpuls/sqrt(variance) > snrThNP)/MfalseAlarmRateNP = 9.8900e-04
Alternatively, use phased.LRTDetector to empirically calculate the detection result and false alarm rate. Stack the two pulses in two rows as the input data. The LRT detection jointly processes each column of the input data. As we test the null hypothesis, the amplitude of the noise-free signal under the alternative hypothesis is irrelevant to the testing and can be set to any real value. Set the amplitude of the noise-free signal under the alternative hypothesis to be 10.
% Configure the LRT detector lrt = phased.LRTDetector('DataComplexity','Real',... 'ProbabilityFalseAlarm',pfa,'ThresholdOutputPort',true); % Known noise-free signal under the alternative hypothesis xnoisefree = 10*ones(2,1); % Stack pulses along column for joint detection pulses = [pulse1;pulse2]; % LRT detection dresult= lrt(pulses,xnoisefree,variance); % Empirical false-alarm rate falseAlarmRateLRT = sum(dresult)/M
falseAlarmRateLRT = 9.8900e-04
The empirical false alarm rate is very close to .
False Alarm Rate for Complex-Valued Signals in Complex White Gaussian Noise
This example shows how to empirically verify the probability of false alarm in a system that uses coherent detection of complex-valued signals. Coherent detection means that the system utilizes information about the phase of the complex-valued signals.
Determine the required SNR for the NP detector (the LRT detector) in a coherent detection scheme with one sample. Use a maximum tolerable false-alarm probability of .
% Probability of false alarm pfa = 1e-3; % SNR threshold in dB snrThdB = npwgnthresh(pfa,1,'coherent'); % SNR threshold snrThNP = sqrt(db2pow(snrThdB));
Test that this threshold empirically results in the correct false-alarm rate. The sufficient statistic in the complex-valued case is the real part of the received sample.
rng default % Noise variance variance = 5; % Number of independent samples M = 1e6; % Data under null hypothesis x = sqrt(variance/2)*(randn(1,M)+1j*randn(1,M)); % Empirical false-alarm rate falseAlarmRateNP = sum(real(x)/sqrt(variance)>snrThNP)/M
falseAlarmRateNP =
9.9500e-04
Alternatively, use phased.LRTDetector to empirically calculate the detection result and false alarm rate. The LRT detector requires inputting the noise-free signal under the alternative hypothesis. As we test the null hypothesis, the complex amplitude of the noise-free signal under the alternative hypothesis is irrelevant to the testing and can be set to any real value. Set the noise-free signal under the alternative hypothesis to be amplitude 10 with random phase.
% Configure the LRT detector lrt = phased.LRTDetector('DataComplexity','Complex',... 'ProbabilityFalseAlarm',pfa,'ThresholdOutputPort',true); % Known noise-free signal under the alternative hypothesis xnoisefree = 10*exp(1j*2*pi*rand); % LRT detection [dresult,~,snrThLRT] = lrt(x,xnoisefree,variance); % Empirical false-alarm rate falseAlarmRateLRT = sum(dresult)/M
falseAlarmRateLRT = 9.6300e-04
The false alarm rates estimated using the above two methods are consistent.
% Difference between SNR thresholds calculated by npwgnthresh and LRT detector
thmse = abs(snrThNP-snrThLRT)^2
thmse = 0
The SNR thresholds generated from npwgnthresh and phased.LRTDetector are also consistent.