Doppler Estimation
This example shows a monostatic pulse radar detecting the radial velocity of moving targets at specific ranges. The speed is derived from the Doppler shift caused by the moving targets. We first identify the existence of a target at a given range and then use Doppler processing to determine the radial velocity of the target at that range.
Radar System Setup
First, we define a radar system. Since the focus of this example is on Doppler processing, we use the radar system built in the example Simulating Test Signals for a Radar Receiver. Readers are encouraged to explore the details of radar system design through that example.
load BasicMonostaticRadarExampleData;System Simulation
Targets
Doppler processing exploits the Doppler shift caused by the moving target. We now define three targets by specifying their positions, radar cross sections (RCS), and velocities.
tgtpos = [[1200; 1600; 0],[3543.63; 0; 0],[1600; 0; 1200]];
tgtvel = [[60; 80; 0],[0;0;0],[0; 100; 0]];
tgtmotion = phased.Platform('InitialPosition',tgtpos,'Velocity',tgtvel);

tgtrcs = [1.3 1.7 2.1];
fc = radiator.OperatingFrequency;
target = phased.RadarTarget('MeanRCS',tgtrcs,'OperatingFrequency',fc);
Note that the first and third targets are both located at a range of 2000 m and are both traveling at a speed of 100 m/s. The difference is that the first target is moving along the radial direction, while the third target is moving in the tangential direction. The second target is not moving.
Environment
We also need to setup the propagation environment for each target. Since we are using a monostatic radar, we use the two way propagation model.
fs = waveform.SampleRate;

channel = phased.FreeSpace(...
    'SampleRate',fs,...
    'TwoWayPropagation',true,...
    'OperatingFrequency',fc);
Signal Synthesis
With the radar system, the environment, and the targets defined, we can now simulate the received signal as echoes reflected from the targets. The simulated data is a data matrix with the fast time (time within each pulse) along each column and the slow time (time between pulses) along each row.
We need to set the seed for noise generation at the receiver so that we can reproduce the same results.
receiver.SeedSource = 'Property';
receiver.Seed = 2009;

prf = waveform.PRF;
num_pulse_int = 10;

fast_time_grid = unigrid(0,1/fs,1/prf,'[)');
slow_time_grid = (0:num_pulse_int-1)/prf;

% Pre-allocate array for improved processing speed
rxpulses = zeros(numel(fast_time_grid),num_pulse_int);

for m = 1:num_pulse_int

    % Update sensor and target positions
    [sensorpos,sensorvel] = sensormotion(1/prf);
    [tgtpos,tgtvel] = tgtmotion(1/prf);

    % Calculate the target angles as seen by the sensor
    [tgtrng,tgtang] = rangeangle(tgtpos,sensorpos);

    % Simulate propagation of pulse in direction of targets
    pulse = waveform();
    [txsig,txstatus] = transmitter(pulse);
    txsig = radiator(txsig,tgtang);
    txsig = channel(txsig,sensorpos,tgtpos,sensorvel,tgtvel);

    % Reflect pulse off of targets
    tgtsig = target(txsig);

    % Receive target returns at sensor
    rxsig = collector(tgtsig,tgtang);
    rxpulses(:,m) = receiver(rxsig,~(txstatus>0));
end
Doppler Estimation
Range Detection
To be able to estimate the Doppler shift of the targets, we first need to locate the targets through range detection. Because the Doppler shift spreads the signal power into both I and Q channels, we need to rely on the signal energy to do the detection. This means that we use noncoherent detection schemes.
The detection process is described in detail in the aforementioned example so we simply perform the necessary steps here to estimate the target ranges.
% calculate initial threshold
pfa = 1e-6;
% in loaded system, noise bandwidth is half of the sample rate
noise_bw = receiver.SampleRate/2;
npower = noisepow(noise_bw,...
    receiver.NoiseFigure,receiver.ReferenceTemperature);
threshold = npower * db2pow(npwgnthresh(pfa,num_pulse_int,'noncoherent'));

% apply matched filter and update the threshold
matchingcoeff = getMatchedFilter(waveform);
matchedfilter = phased.MatchedFilter(...
    'Coefficients',matchingcoeff,...
    'GainOutputPort',true);
[rxpulses, mfgain] = matchedfilter(rxpulses);
threshold = threshold * db2pow(mfgain);

% compensate the matched filter delay
matchingdelay = size(matchingcoeff,1)-1;
rxpulses = buffer(rxpulses(matchingdelay+1:end),size(rxpulses,1));

% apply time varying gain to compensate the range dependent loss
prop_speed = radiator.PropagationSpeed;
range_gates = prop_speed*fast_time_grid/2;
lambda = prop_speed/fc;

tvg = phased.TimeVaryingGain(...
    'RangeLoss',2*fspl(range_gates,lambda),...
    'ReferenceLoss',2*fspl(prop_speed/(prf*2),lambda));

rxpulses = tvg(rxpulses);

% detect peaks from the integrated pulse
[~,range_detect] = findpeaks(pulsint(rxpulses,'noncoherent'),...
    'MinPeakHeight',sqrt(threshold));
range_estimates = round(range_gates(range_detect))
range_estimates = 1×2

        2000        3550
These estimates suggest the presence of targets in the range of 2000 m and 3550 m.
Doppler Spectrum
Once we successfully estimated the ranges of the targets, we can then estimate the Doppler information for each target.
Doppler estimation is essentially a spectrum estimation process. Therefore, the first step in Doppler processing is to generate the Doppler spectrum from the received signal.
The received signal after the matched filter is a matrix whose columns correspond to received pulses. Unlike range estimation, Doppler processing processes the data across the pulses (slow time), which is along the rows of the data matrix. Since we are using 10 pulses, there are 10 samples available for Doppler processing. Because there is one sample from each pulse, the sampling frequency for the Doppler samples is the pulse repetition frequency (PRF).
As predicted by the Fourier theory, the maximum unambiguous Doppler shift a pulse radar system can detect is half of its PRF. This also translates to the maximum unambiguous speed a radar system can detect. In addition, the number of pulses determines the resolution in the Doppler spectrum, which determines the resolution of the speed estimates.
max_speed = dop2speed(prf/2,lambda)/2
max_speed = 224.6888
speed_res = 2*max_speed/num_pulse_int
speed_res = 44.9378
As shown in the calculation above, in this example, the maximum detectable speed is 225m/s, either approaching (-225) or departing (+225). The resulting Doppler resolution is about 45 m/s, which means that the two speeds must be at least 45 m/s apart to be separable in the Doppler spectrum. To improve the ability to discriminate between different target speeds, more pulses are needed. However, the number of pulses available is also limited by the radial velocity of the target. Since the Doppler processing is limited to a given range, all pulses used in the processing have to be collected before the target moves from one range bin to the next.
Because the number of Doppler samples are in general limited, it is common to zero pad the sequence to interpolate the resulting spectrum. This will not improve the resolution of the resulting spectrum, but can improve the estimation of the locations of the peaks in the spectrum.
The Doppler spectrum can be generated using a periodogram. We zero pad the slow time sequence to 256 points.
num_range_detected = numel(range_estimates);
[p1, f1] = periodogram(rxpulses(range_detect(1),:).',[],256,prf, ...
                'power','centered');
[p2, f2] = periodogram(rxpulses(range_detect(2),:).',[],256,prf, ...
                'power','centered');
The speed corresponding to each sample in the spectrum can then be calculated. Note that we need to take into consideration of the round trip effect.
speed_vec = dop2speed(f1,lambda)/2;
Doppler Estimation
To estimate the Doppler shift associated with each target, we need to find the locations of the peaks in each Doppler spectrum. In this example, the targets are present at two different ranges, so the estimation process needs to be repeated for each range.
Let's first plot the Doppler spectrum corresponding to the range of 2000 meters.
periodogram(rxpulses(range_detect(1),:).',[],256,prf,'power','centered');
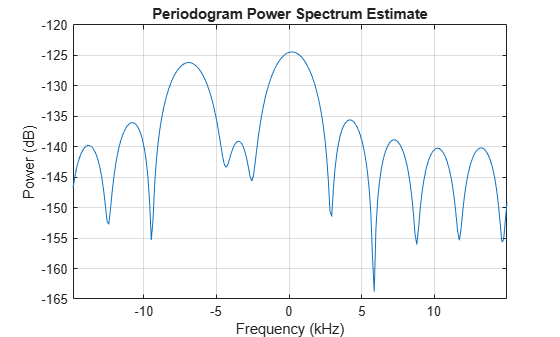
Note that we are only interested in detecting the peaks, so the spectrum values themselves are not critical. From the plot of Doppler spectrum, we notice that 5 dB below the maximum peak is a good threshold. Therefore, we use -5 as our threshold on the normalized Doppler spectrum.
spectrum_data = p1/max(p1);
[~,dop_detect1] = findpeaks(pow2db(spectrum_data),'MinPeakHeight',-5);
sp1 = speed_vec(dop_detect1)
sp1 = 2×1
-103.5675
3.5108
The results show that there are two targets at the 2000 m range: one with a velocity of 3.5 m/s and the other with -104 m/s. The value -104 m/s can be easily associated with the first target, since the first target is departing at a radial velocity of 100 m/s, which, given the Doppler resolution of this example, is very close to the estimated value. The value 3.5 m/s requires more explanation. Since the third target is moving along the tangential direction, there is no velocity component in the radial direction. Therefore, the radar cannot detect the Doppler shift of the third target. The true radial velocity of the third target, hence, is 0 m/s and the estimate of 3.5 m/s is very close to the true value.
Note that these two targets cannot be discerned using only range estimation because their range values are the same.
The same operations are then applied to the data corresponding to the range of 3550 meters.
periodogram(rxpulses(range_detect(2),:).',[],256,prf,'power','centered');
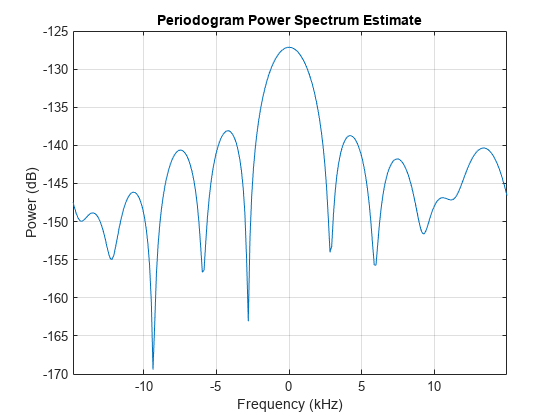
spectrum_data = p2/max(p2);
[~,dop_detect2] = findpeaks(pow2db(spectrum_data),'MinPeakHeight',-5);
sp2 = speed_vec(dop_detect2)
sp2 = 0
This result shows an estimated speed of 0 m/s, which matches the fact that the target at this range is not moving.
Summary
This example showed a simple way to estimate the radial speed of moving targets using a pulse radar system. We generated the Doppler spectrum from the received signal and estimated the peak locations from the spectrum. These peak locations correspond to the target's radial speed. The limitations of the Doppler processing are also discussed in the example.
You can also select a web site from the following list:
Americas
- América Latina (Español)
- Canada (English)
- United States (English)
Europe
- Belgium (English)
- Denmark (English)
- Deutschland (Deutsch)
- España (Español)
- Finland (English)
- France (Français)
- Ireland (English)
- Italia (Italiano)
- Luxembourg (English)
- Netherlands (English)
- Norway (English)
- Österreich (Deutsch)
- Portugal (English)
- Sweden (English)
- Switzerland
- United Kingdom (English)