Read Streaming Data from Arduino Using Serial Port Communication
This example shows how to enable callbacks to read streaming ASCII terminated data from an Arduino® board using the serialport interface.
This example uses an Arduino Due; however, most Arduino boards should work.
Upload a Program to the Arduino
Plug in an Arduino board to your computer.
Upload the following program to the Arduino® board using the Arduino IDE. This program writes out continuous points of a sine wave, followed by the "Carriage Return" and "Linefeed" terminators. For convenience, this program is available in the example folder as SineWavePoints.``ino.
/*
 SineWavePoints

 Write sine wave points to the serial port, followed by the Carriage Return and LineFeed terminator.
 */

int i = 0;

// The setup routine runs once when you press reset:
void setup() {
  // Initialize serial communication at 9600 bits per second:
  Serial.begin(9600);
}

// The routine loops forever:
void loop() {
  // Write the sinewave points, followed by the terminator "Carriage Return" and "Linefeed".
  Serial.print(sin(i*50.0/360.0));
  Serial.write(13);
  Serial.write(10);
  i += 1;
}
Establish a Connection to the Arduino
In MATLAB, close all existing serialport connections.
delete(serialportfind);
Find the serial port that the Arduino is connected to. You can identify the port from the Arduino IDE. For this example, suppose that the Arduino IDE indicates that the connection is at port COM4. Confirm that this port exists on your machine by listing all available ports.
serialportlist("available")ans = 1×2 string array
"COM3" "COM4"
Connect to the Arduino Due by creating a serialport object. Use the port and baud specified in the Arduino code.
serialObj = serialport("COM4",9600)serialObj =
Serialport with properties:
Port: "COM4"
BaudRate: 9600
Tag: ""
NumBytesAvailable: 15
Show all properties, functions
Prepare the serialport Object to Start Streaming Data
Configure the serialport object by configuring its properties and clearing old data.
Set the Terminator property to match the terminator that you specified in the Arduino code.
configureTerminator(serialObj,"CR/LF");Flush the serialport object to remove any old data.
flush(serialObj);
Prepare the UserData property to store the Arduino data. In this case, define UserData to be a struct in which the Data field contains sine wave values and Count records the number of data points collected. This structure allows for organized and efficient access and updating of these related pieces of information.
serialObj.UserData = struct("Data",[],"Count",1)
serialObj =
  Serialport with properties:

                 Port: "COM4"
             BaudRate: 9600
                  Tag: ""
    NumBytesAvailable: 0

  Show all properties, functions
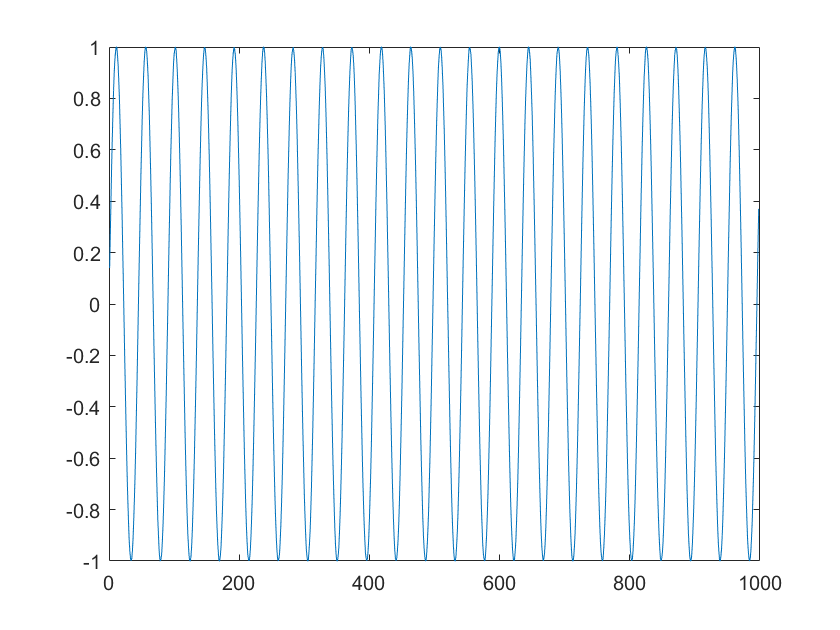
The file readSineWaveData.m in the example folder defines the callback function that reads the first 1000 ASCII terminated sine wave data points and plots the result. This function takes in an argument maxDataPoints that determines when to plot the data.
function readSineWaveData(src, ~, maxDataPoints)

% Read the ASCII data from the serialport object.
data = readline(src);

% Convert the string data to numeric type and save it in the UserData
% property of the serialport object.
src.UserData.Data(end+1) = str2double(data);

% Update the Count value of the serialport object.
src.UserData.Count = src.UserData.Count + 1;

% If over maxDataPoints points have been collected from the Arduino, switch off the
% callbacks and plot the data, starting from the second point.
if src.UserData.Count > maxDataPoints
    configureCallback(src, "off");
    plot(src.UserData.Data(2:end));
end
end
Configure the serial port object to execute the readSineWaveData function whenever new data, indicated by the terminator, is available to read from the Arduino. The following configureCallback command sets the BytesAvailableFcnMode to "terminator" and the BytesAvailableFcn property to a handle to readSineWaveData function.
maxDataPoints = 1002;
configureCallback(serialObj, "terminator", @(src,event) readSineWaveData(src,event,maxDataPoints))
The callback function opens the MATLAB figure with a plot of the first 1000 data points.