Line Plot with Confidence Bounds
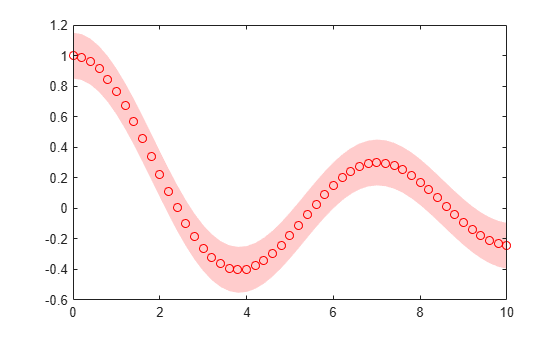
Create a plot with confidence bounds using the fill function to draw the confidence bounds and the plot function to draw the data points. Use dot notation syntax object.PropertyName to customize the look of the plot.
x = 0:0.2:10;
y = besselj(0, x);

xconf = [x x(end:-1:1)] ;
yconf = [y+0.15 y(end:-1:1)-0.15];

figure
p = fill(xconf,yconf,'red');
p.FaceColor = [1 0.8 0.8];
p.EdgeColor = 'none';

hold on
plot(x,y,'ro')
hold off