Clipping in Plots and Graphs
This example shows how MATLAB® uses clipping in plots and how to control clipping.
What Is Clipping?
Clipping occurs when part of an object extends outside the boundaries of the axes in a plot. In MATLAB®, the part of the object that is clipped does not appear on the screen or in printed output. By default, MATLAB clips most objects at the axis limits.
Turn Clipping Off
Clipping in 2-D Plots
Clipping occurs in 2-D plots. For example, MATLAB clips the sine wave in this 2-D plot.
x = 0:pi/20:2*pi;
y = sin(x);
plot(x,y)
xlim([0,2*pi])
ylim([-0.9 0.9])
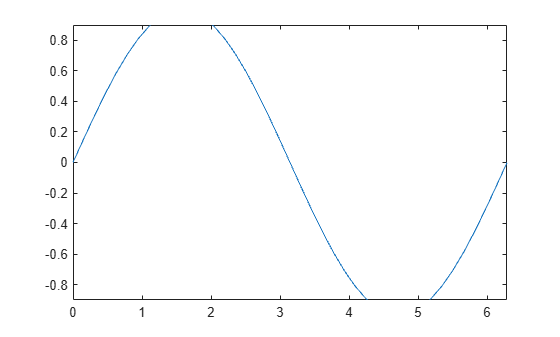
You can control the clipping of the sine wave by using the axes Clipping property. Turn clipping "off" to display the entire sine wave.
ax = gca;
ax.Clipping = "off";
Clipping in 3-D Plots
Clipping also occurs in 3-D plots. For example, MATLAB clips the surface in this 3-D plot.
figure
surf(peaks)
zlim([-4 4])
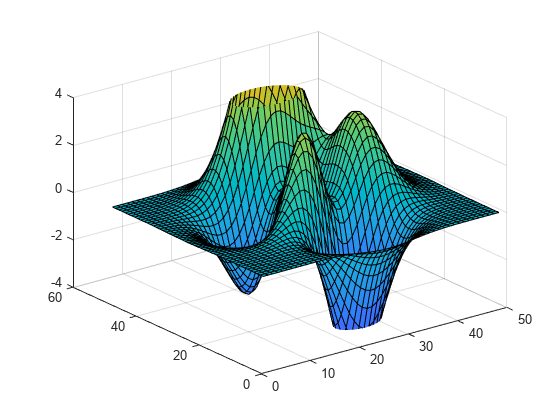
You can control the clipping behavior of the axes by using the axes Clipping property. Turn clipping "off" to display the entire surface.
ax = gca;
ax.Clipping = "off";
Control the Clipping Style
Use the ClippingStyle property to control the way clipping works with respect to the axes. If you set ClippingStyle to "3dbox", then MATLAB clips objects to the volume defined by the limits of the x-, y-, and *z-*axes. If you set ClippingStyle to "rectangle", then MATLAB clips objects at an imaginary rectangle drawn around the outside of the x-, y-, and *z-*axes. These plots show the difference between the two clipping styles.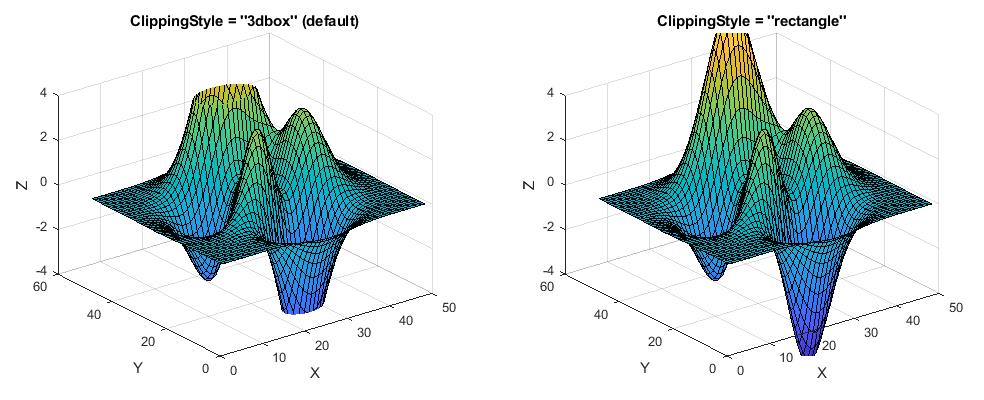
Control Text Clipping
Objects other than axes have the Clipping property. MATLAB can also clip text objects at the axes plot box. For example, plot some data and add a text description. By default, the Clipping property for text objects is set to "off", so if you zoom or pan, text can extend outside the axis limits.
figure
x = 1:10;
y = -10:10;
[X,Y] = meshgrid(x,y);
Z = X.^2-Y.^2;
surf(X,Y,Z);
ylim([-20.5 1.5])

t = text(1,7,60,"example");
If you set the text Clipping property to "on", the full text disappears from view when the (x,y,z) position of the text object, also known as the anchor point, is outside the axes plot box.
t.Clipping = "on";
If you want the text to clip at the axes plot box and show partial text, then also set the axes ClippingStyle property to "rectangle".
ax = gca;
ax.ClippingStyle = "rectangle";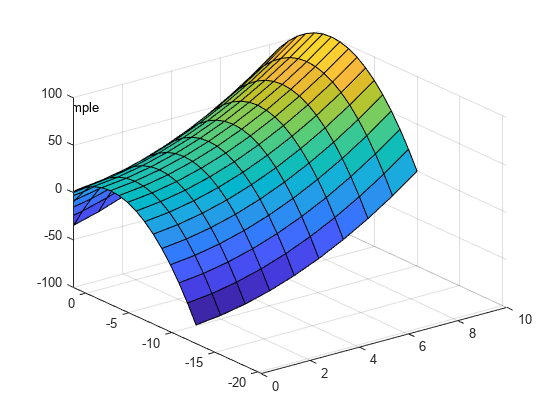
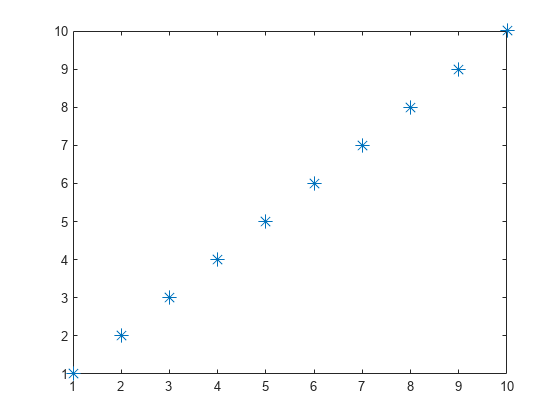
Clipping and Markers
Clipping does not affect markers drawn at each data point as long as the data point itself is inside the x- and *y-*axes limits of the plot. MATLAB displays the entire marker even if it extends slightly outside the boundaries of the axes.
p = plot(1:10,'*');
p.MarkerSize = 10;
axis([1 10 1 10])