Uplink Carrier Aggregation Waveform Generation, Demodulation, and Analysis
This example shows how multiple uplink carriers can be generated, aggregated, and demodulated using LTE Toolbox™. Error Vector Magnitude (EVM) and in-band emissions are measured for the demodulated carrier as per TS 36.101 Annex F [ 1 ].
Introduction
This example models an LTE uplink waveform with Carrier Aggregation (CA). The number of component carriers (CC) and their respective bandwidths can be specified as a parameter. An intra-band contiguous CA case is considered as per TS 36.101 V15.4.0.
To generate an aggregated uplink waveform a user equipment (UE) is configured for each component carrier. Carrier aggregation parameters are calculated and used to generate a modulated waveform for each CC configuration. All the component carrier modulated waveforms are resampled to a common sampling rate so that they can be combined to create an aggregated waveform. The aggregated waveform is demodulated and filtered to extract the component carrier of interest. Then EVM and in-band emissions are measured for that CC and finally a CRC check is made by performing PUSCH decoding.
Number of Component Carriers and Bandwidths
A vector NULRB specifies the number of resource blocks (RBs) for each component carrier. The length of this vector corresponds to the number of CCs. The elements of NULRB must be in the set {6, 15, 25, 50, 75, 100} RBs. TS 36.101 Table 5.6A.1-1 [ 1 ] lists the valid combinations of bandwidths for carrier aggregation.
% Configure the set of NULRB values to describe the carriers to be
% aggregated
NULRB = [50 75 100];

% Establish the number of component carriers
numCC = numel(NULRB);

CCBWs = zeros(1,numCC);

if numCC<2
    error('Please specify more than one CC bandwidth value.');
end
UE Configuration for Each Component Carrier
A configuration structure is generated for each CC using lteRMCUL. To show the in-band emissions, partial RB allocation is being considered for each CC. The configuration structures for all CCs are stored in a cell array.
% Specify the number of subframes to generate
numSubframes = 10;

% Configure CCs
frc = cell(1,numCC);
for i = 1:numCC
    switch NULRB(i)
        case 6
            frc{i} = lteRMCUL('A3-1');
            frc{i}.PUSCH.PRBSet = (0:2).';
        case 15
            frc{i} = lteRMCUL('A1-2');
            frc{i}.PUSCH.PRBSet = (0:8).';
        case 25
            frc{i} = lteRMCUL('A1-3');
            frc{i}.PUSCH.PRBSet = (0:15).';
        case 50
            frc{i} = lteRMCUL('A3-5');
            frc{i}.PUSCH.PRBSet = (0:39).';
        case 75
            frc{i} = lteRMCUL('A3-6');
            frc{i}.PUSCH.PRBSet = (0:59).';
        case 100
            frc{i} = lteRMCUL('A3-7');
            frc{i}.PUSCH.PRBSet = (0:80).';
        otherwise
            fprintf('Not a valid number of resource blocks: %d\n',...
                NULRB(i));
            return
    end
    CCBWs(i) = hNRBToBandwidth(NULRB(i));
    frc{i}.Bandwidth = CCBWs(i);
    frc{i}.TotSubframes = numSubframes;
    frc{i}.PUSCH.RVSeq = 0;
end
Channel Estimator Configuration
The channel estimator at the receiver end is parameterized using the structure cec defined below.
cec = struct;                        % Channel estimation config structure
cec.PilotAverage = 'UserDefined';    % Type of pilot symbol averaging
cec.FreqWindow = 15;                 % Frequency window size
cec.TimeWindow = 15;                 % Time window size
cec.InterpType = 'Cubic';            % 2D interpolation type
cec.InterpWindow = 'Centered';       % Interpolation window type
cec.InterpWinSize = 1;               % Interpolation window size
cec.Reference = 'Antennas';          % Specifies point of reference for
                                     % channel estimation.
Carrier Aggregation Parameters Calculation
To perform carrier aggregation the frequency parameters described in TS 36.101, Sections 5.6 and 5.7 [ 1 ] are calculated. These parameters are summarized in the following figure.
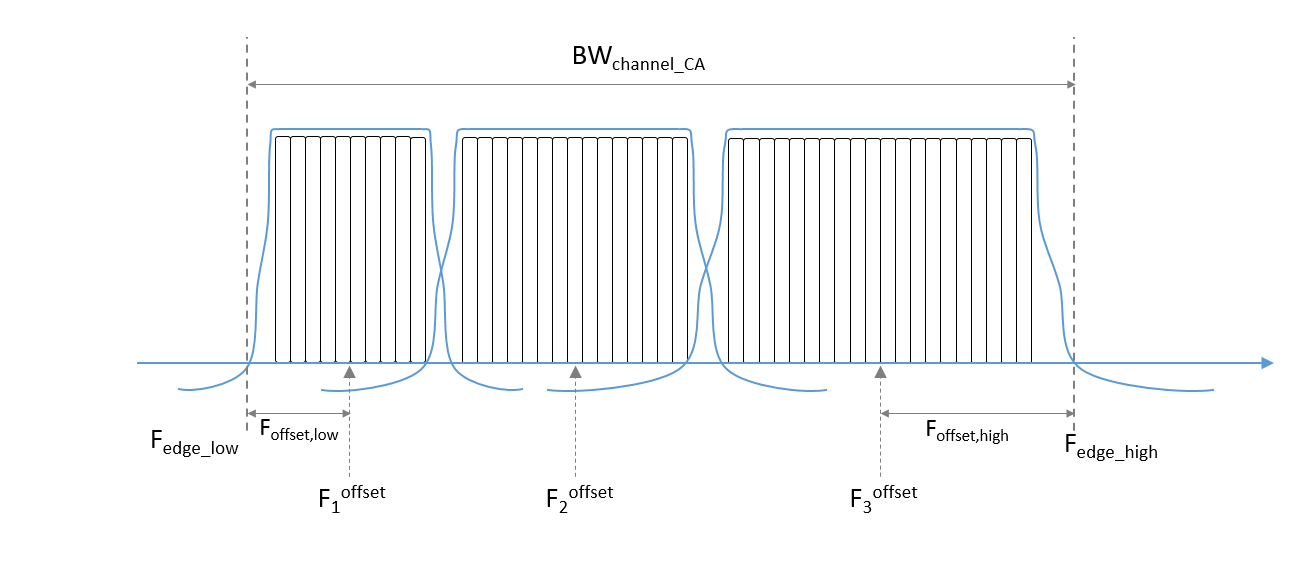
This results in three variables:
F_cis a vector containing the center frequency of each CCccSpacingcontains the spacing between CCs in MHzBW_channel_CAis the aggregated channel bandwidth of all CCs
In the code below we first calculate the value for all the CCs assuming the lower one is centered at baseband (0 Hz). Once the BW_channel_CA is calculated all the values are shifted so that the center of the aggregated bandwidth is located at baseband (0 Hz).
% Define Delta_f1 parameter in MHz for nominal guard band and frequency
% offset calculations. In the uplink Delta_f1 is zero
% (TS 36.101, Table 5.6A-1)
Delta_f1 = 0; % in MHz
maxBW = max(CCBWs);

% Initialize center frequency and CC spacing vectors
F_c = zeros(1,numCC); % Center frequencies
ccSpacing = zeros(1,numCC-1); % CC spacing

% Calculate nominal guard band, TS 36.101 5.6A-1
nominalGuardBand = 0.05*maxBW-0.5*Delta_f1;

% Initially assume lower carrier frequency is at baseband
F_c(1) = 0;

% Calculate CC spacing and center frequencies
for k = 2:numCC
    ccSpacing(k-1) = hCarrierAggregationChannelSpacing( ...
        frc{k-1}.Bandwidth, frc{k}.Bandwidth);
    F_c(k) = F_c(k-1) + ccSpacing(k-1);
end

% Calculate lower and higher frequency offsets, TS 36.101 5.6A
F_offset_low = (0.18*NULRB(1)+Delta_f1)/2 + nominalGuardBand;
F_offset_high = (0.18*NULRB(end)+Delta_f1)/2 + nominalGuardBand;

% Calculate lower and higher frequency edges, TS 36.101 5.6A
F_edge_low = F_c(1) - F_offset_low;
F_edge_high = F_c(end) + F_offset_high;

% Calculate aggregated channel bandwidth, TS 36.101 5.6A
BW_channel_CA = F_edge_high - F_edge_low;
fprintf('BW_channel_CA: %0.4f MHz\n',BW_channel_CA);

% Calculate shift to center baseband
shiftToCenter = -1*(BW_channel_CA/2 + F_edge_low);

% Shift the center frequencies so that the aggregated bandwidth is centered
% at baseband
F_c = F_c + shiftToCenter;
F_edge_low = F_c(1) - F_offset_low;
F_edge_high = F_c(end) + F_offset_high;

% Display frequency band edges
fprintf('F_edge_low:  %0.4f MHz\n',F_edge_low);
fprintf('F_edge_high: %0.4f MHz\n',F_edge_high);
fprintf('F_offset_low:  %0.4f MHz\n',F_offset_low);
fprintf('F_offset_high: %0.4f MHz\n',F_offset_high);

% Display carrier frequencies
fprintf('\n');
for i = 1:numCC
    fprintf('Component Carrier %d:\n',i);
    fprintf('Fc: %0.4f MHz\n', F_c(i));
end
BW_channel_CA: 44.6000 MHz
F_edge_low:  -22.3000 MHz
F_edge_high: 22.3000 MHz
F_offset_low:  5.5000 MHz
F_offset_high: 10.0000 MHz

Component Carrier 1:
Fc: -16.8000 MHz
Component Carrier 2:
Fc: -4.8000 MHz
Component Carrier 3:
Fc: 12.3000 MHz
Required Oversampling Rate Calculation
The required oversampling factors for each component carrier OSRs are calculated for a common sampling rate for the aggregated signal.
% Considering the bandwidth utilization as 85%
bwfraction = 0.85;

% Calculate sampling rates of the component carriers
CCSR = zeros(1,numCC);
for i = 1:numCC
    info = lteSCFDMAInfo(frc{i});
    CCSR(i) = info.SamplingRate;
end

% Calculate overall sampling rate for the aggregated signal

% Calculate the oversampling ratio (for the largest BW CC) to make sure the
% signal occupies 85% (bwfraction) of the aggregated channel bandwidth
OSR = (BW_channel_CA/bwfraction)/(max(CCSR)/1e6);
% To simplify the resampling operation, choose an oversampling ratio as the
% smallest power of 2 greater than or equal to OSR
OSR = 2^ceil(log2(OSR));
SR = OSR*max(CCSR);
fprintf('\nOutput sample rate: %0.4f Ms/s\n\n',SR/1e6);

% Calculate individual oversampling factors for the component carriers
OSRs = SR./CCSR;
Output sample rate: 61.4400 Ms/s
Waveform Generation and Carrier Aggregation
Generate the waveform for each CC using lteRMCULTool, then resample them to a common sampling rate. Finally, frequency modulate each CC to the appropriate center frequency and add them together to form the aggregated signal using Multiband Combiner.
% Generate component carriers
tx = cell(1,numCC);
for i = 1:numCC
    tx{i} = lteRMCULTool(frc{i},randi([0 1],1000,1));
    tx{i} = resample(tx{i},OSRs(i),1)/OSRs(i);
end

% Aggregate all CC. comm.MultibandCombiner applies the frequency offsets
% and adds the resulting signals together.
sigAggregator = comm.MultibandCombiner(InputSampleRate = SR, ...
    FrequencyOffsets = F_c*1e6, ...
    OutputSampleRateSource = 'Property', ...
    OutputSampleRate = SR);

waveform = sigAggregator([tx{:}]);
Plot Carrier Aggregation Waveform Spectrum
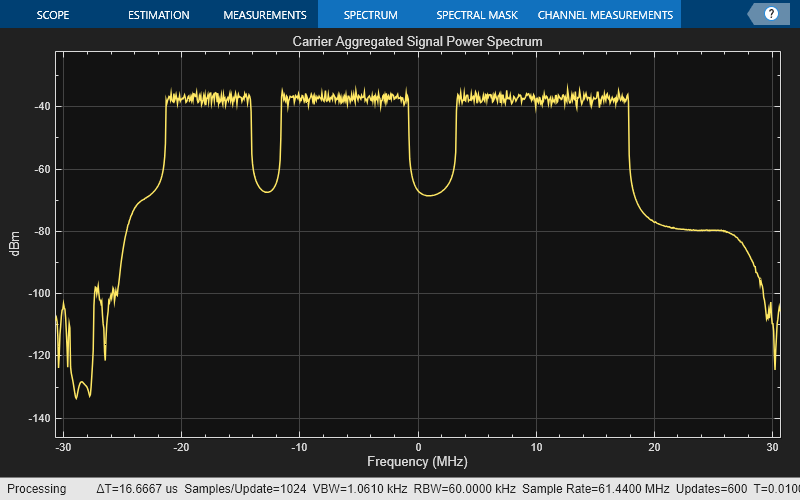
Display the power spectrum of the carrier aggregated signal. In the spectrum the individual carrier bandwidths are visible. Note that the center of the aggregated bandwidth is located at baseband (0 Hz) as the signal is not modulated to RF in this example.
specPlot = spectrumAnalyzer('SampleRate',SR,'Title','Carrier Aggregated Signal Power Spectrum');
specPlot(waveform);
Demodulation and Filtering of CC of Interest
This section shows how to demodulate, filter, and downsample one of the CC of interest. The steps followed are:
Demodulate the CC of interest and bring it to baseband (0 Hz).
Filter out neighboring CCs and downsample. A suitable filter is designed to remove the unwanted neighboring CCs in the downsampling process. The filter design will have an impact on the quality and EVM of the recovered signal. Filters may need to be tweaked for different values of bandwidth and CC to demodulate.
We start by selecting the CC to demodulate and designing the appropriate downsampling filter with the calculated passband and stopband frequencies.
% Select CC to demodulate
CCofInterest = 1;
if CCofInterest > numCC || CCofInterest <= 0
    error('Cannot demodulate CC number %d, there are %d CCs\n',...
        CCofInterest, numCC) ;
end

% Define downsampling filter order
filterOrder = 301;

% Precalculate passband and stopband values for all CC
firPassbandVec = (0.18*NULRB+Delta_f1)/2 / (SR/1e6/2);
firStopbandVec = hCarrierAggregationStopband(ccSpacing,NULRB,SR);

% Define passband and stopband for carrier of interest
firPassband = firPassbandVec(CCofInterest);
firStopband = firStopbandVec(CCofInterest);

% Extract and decode CC of interest
fprintf(1,'Extracting CC number %d: \n', CCofInterest);

% Pad signal with zeros to take into account filter transient response
% length
waveform = [waveform; zeros(filterOrder+1,size(waveform,2))];

% Demodulate carrier of interest
demodulatedCC = ...
    hCarrierAggregationModulate(waveform,SR,-F_c(CCofInterest)*1e6);

% Downsampling is done in two stages if the filter is too narrow. This
% eases the filter design requirements. If this is the case an initial
% downsampling factor of 4 is applied. You may want to consider a different
% filter design in this initial stage if the quality of the resulting
% signal is not acceptable.
if (firStopband < 0.1)
    % Down-sample by 4
    SRC = 4;
    demodulatedCC = resample(demodulatedCC,1,SRC);
    % Update pass and stopband to take first downsampling into account
    firPassband = firPassband * SRC;
    firStopband = firStopband * SRC;
else
    % No pre-filter
    SRC = 1;
end

% Design lowpass filter to filter out CC of interest
frEdges = [0 firPassband firStopband 1];
firFilter = dsp.FIRFilter;
firFilter.Numerator = firpm(filterOrder,frEdges,[1 1 0 0]);
Extracting CC number 1:
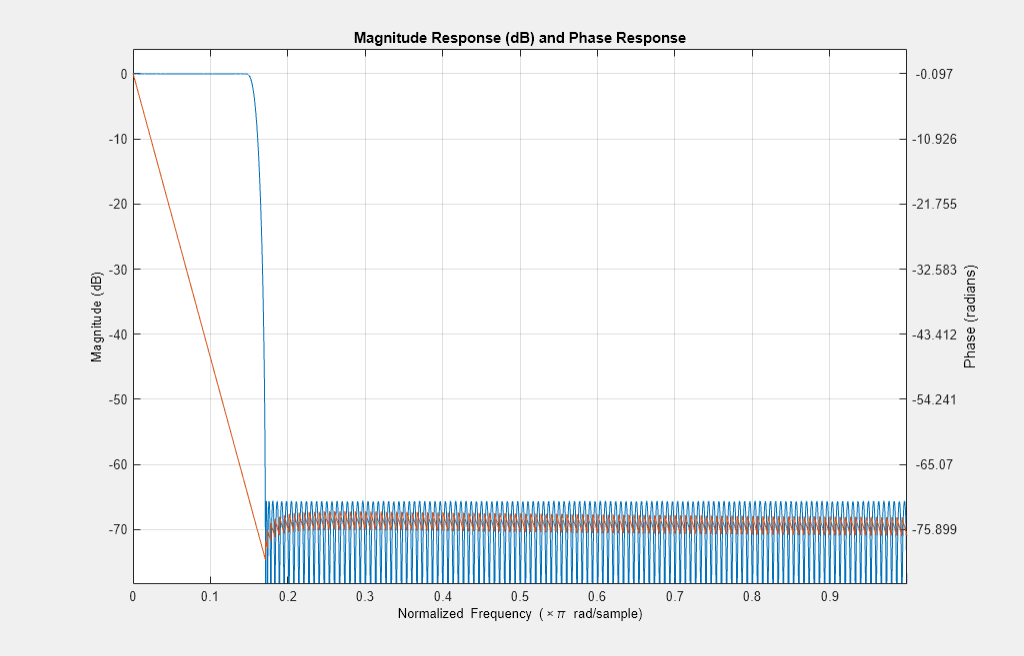
The response of the designed filter is displayed.
freqz(firFilter);
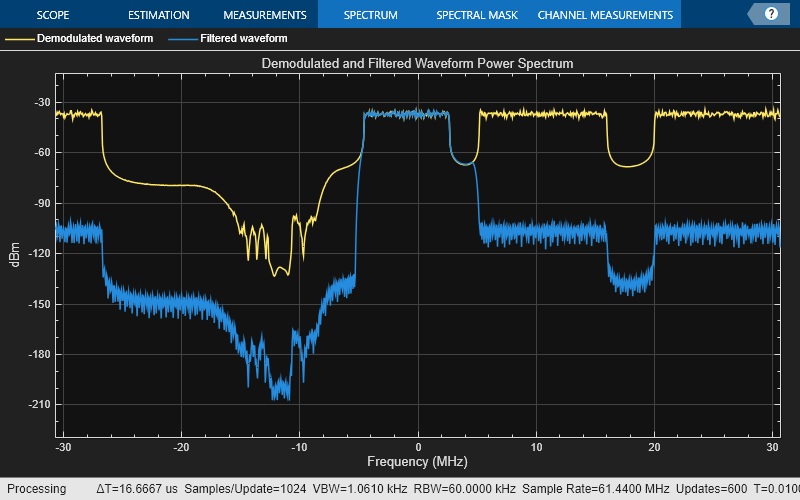
The demodulated waveform is then filtered to extract the CC of interest. The spectrum of the demodulated waveform before and after the filtering is plotted.
% Filter the signal to extract the component of interest
rxWaveform  = firFilter(demodulatedCC);

% Plot the demodulated and filtered signal spectra
filteredSpecPlot = spectrumAnalyzer('SampleRate',SR,'Title','Demodulated and Filtered Waveform Power Spectrum',...
                                    'ChannelNames',{'Demodulated waveform' 'Filtered waveform'},'ShowLegend',true);
filteredSpecPlot([demodulatedCC, rxWaveform]);
At this point the filtered waveform can be downsampled to its baseband rate.
rxWaveform = downsample(rxWaveform,OSRs(CCofInterest)/SRC);
Synchronization
Synchronization is applied to the resulting signal before EVM and in-band emissions measurement.
% Get the parameters for CC of interest
FRC = frc{CCofInterest};
PUSCH = FRC.PUSCH;

% Synchronize received waveform
offset = lteULFrameOffset(FRC,PUSCH,rxWaveform);
rxWaveform = rxWaveform(1+offset:end, :);
EVM, In-Band Emissions Measurements, and PUSCH Decoding
The code below provides PUSCH EVM, PUSCH DRS EVM, and in-band emissions calculation using hPUSCHEVM.
The EVM is the difference between the reconstructed ideal symbols and measured received symbols over one slot measurement interval in the time domain. The process of reconstructing the ideal symbols includes:
Single-carrier frequency division multiple access (SC-FDMA) demodulation to obtain the received resource grid
Channel estimation
PUSCH equalization
Symbol demodulation
Decoding followed by reencoding of the received bits, rescrambling and remodulation
The average EVM is measured at two locations in time (low and high, which are denoted as  and
and  ), where the low and high locations correspond to the alignment of the FFT window within the start and end of the cyclic prefix. LTE Toolbox requires the low and high locations to be specified as a fraction of the cyclic prefix length.
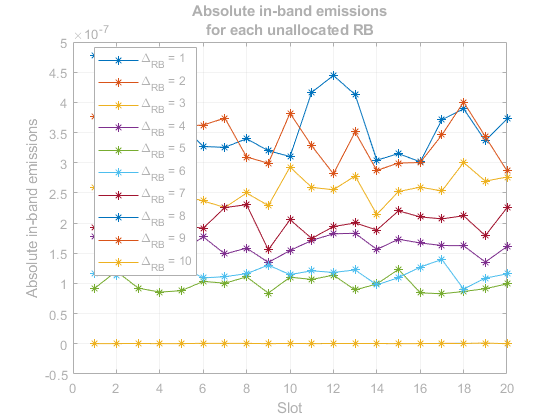
The in-band emissions are a measure of the interference falling into the non-allocated RBs. In-band emissions are calculated for each  and slot number, where is the starting frequency offset between the allocated RB and the measured non-allocated RB (e.g.,
  for the first adjacent RB outside of the allocated bandwidth).
From the above measurements the following plots are also produced:
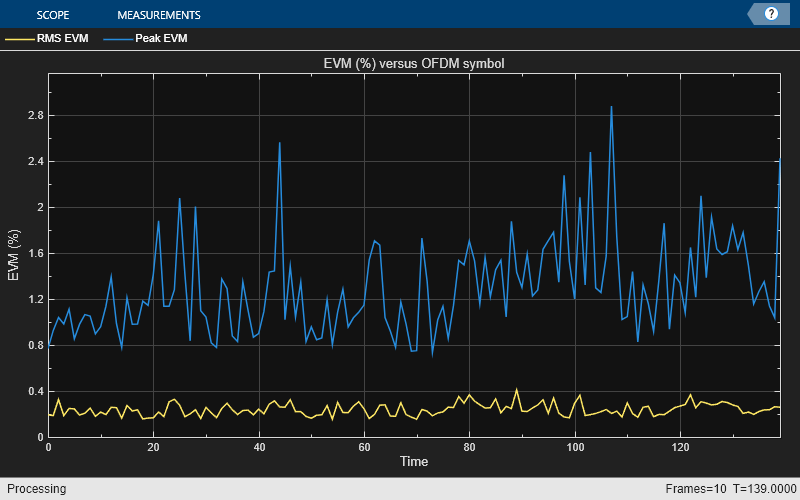
EVM versus OFDM symbol
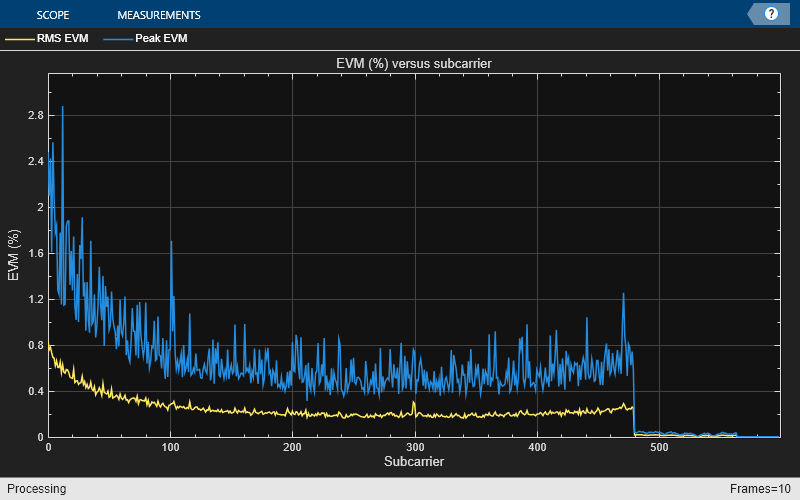
EVM versus subcarrier
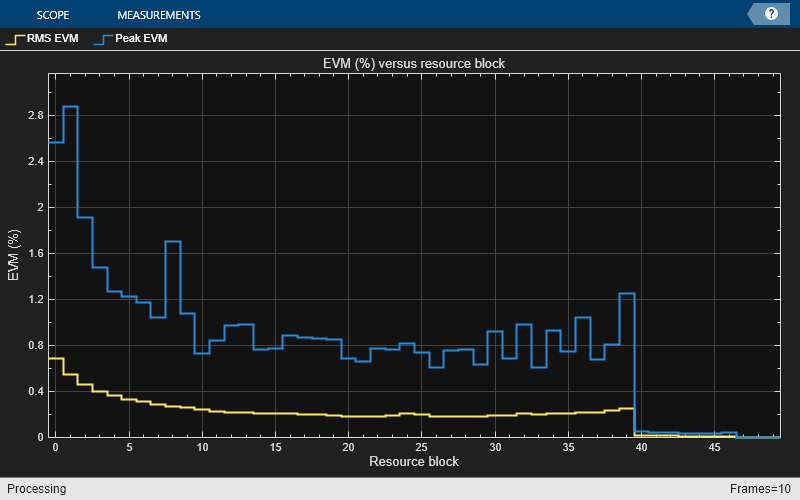
EVM versus resource block
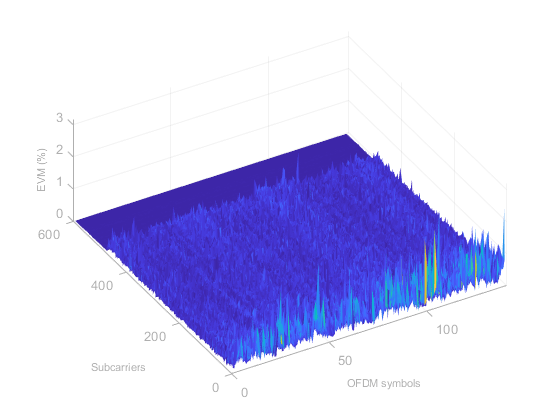
EVM versus OFDM symbol and subcarrier (i.e. the EVM resource grid)
Uplink in-band emissions for non-allocated RBs
Note that the EVM measurements displayed at the command window are only calculated across allocated PUSCH resource blocks, in accordance with the LTE standard. The EVM plots are shown across all resource blocks (allocated or unallocated), allowing the in-band emissions to be viewed. In unallocated resource blocks, the EVM is calculated assuming that the received resource elements have an expected value of zero.
The PUSCH of the recovered signal is then decoded and the resulting CRC is checked for errors.
% Configure channel estimation structure for EVM measurement
cecEVM = cec;
cecEVM.PilotAverage = 'TestEVM';
[evmpusch, evmdrs, emissions, plots] = hPUSCHEVM(frc{CCofInterest},cecEVM,rxWaveform);

% Plot the absolute in-band emissions
if (~isempty(emissions.DeltaRB))
    hPUSCHEVMEmissionsPlot(emissions);
end

% Perform SC-FDMA demodulation
rxGrid = lteSCFDMADemodulate(FRC,rxWaveform);

% Get the number of received subframes and OFDM symbols per subframe
dims = lteSCFDMAInfo(FRC);
samplesPerSubframe = dims.SamplingRate/1000;
nRxSubframes = floor(size(rxWaveform, 1)/samplesPerSubframe);
FRC.TotSubframes = 1;
resGridSize = lteResourceGridSize(FRC);
L = resGridSize(2);

disp('Decode transmitted subframes and check CRC.');

for n=0:nRxSubframes-1

    % Extract subframe
    rxSubframe = rxGrid(:,(1:L)+(n*L),:);

    % Get the transport block size for current subframe
    FRC.NSubframe = n;
    trBlkSize = PUSCH.TrBlkSizes(n+1);

    % Perform channel estimation
    [estChannelGrid, noiseEst] = lteULChannelEstimate( ...
        FRC, PUSCH, cec, rxSubframe);

    % Generate PUSCH indices and extract symbols from received and
    % channel estimate grids in preparation for PUSCH decoding
    ind = ltePUSCHIndices(FRC, PUSCH);
    [rxSym,hestSym] = lteExtractResources(ind, rxSubframe, estChannelGrid);

    % Update PUSCH to carry complete information of the UL-SCH coding
    PUSCH = lteULSCHInfo(FRC, PUSCH, trBlkSize, 'chsconcat');

    % Perform equalization, transform deprecoding, layer demapping,
    % demodulation, and descrambling on the received data using the channel
    % estimate
    [rxEncodedBits, puschsymbols] = ltePUSCHDecode(FRC, PUSCH, ...
        rxSym, hestSym, noiseEst);

    % Decode Uplink Shared Channel (UL-SCH)
    decState = [];
    [decbits,crc] = ...
        lteULSCHDecode(FRC, PUSCH, trBlkSize ,rxEncodedBits, decState);
    if crc
        disp(['Subframe ' num2str(n) ': CRC failed']);
    else
        disp(['Subframe ' num2str(n) ': CRC passed']);
    end
end
Low edge PUSCH EVM, slot 0: 0.184%
Low edge PUSCH EVM, slot 1: 0.198%
Low edge DRS EVM, slot 0: 0.291%
Low edge DRS EVM, slot 1: 0.194%
High edge PUSCH EVM, slot 0: 0.264%
High edge PUSCH EVM, slot 1: 0.253%
High edge DRS EVM, slot 0: 0.208%
High edge DRS EVM, slot 1: 0.242%
Low edge PUSCH EVM, slot 2: 0.245%
Low edge PUSCH EVM, slot 3: 0.190%
Low edge DRS EVM, slot 2: 0.278%
Low edge DRS EVM, slot 3: 0.292%
High edge PUSCH EVM, slot 2: 0.220%
High edge PUSCH EVM, slot 3: 0.258%
High edge DRS EVM, slot 2: 0.264%
High edge DRS EVM, slot 3: 0.367%
Low edge PUSCH EVM, slot 4: 0.210%
Low edge PUSCH EVM, slot 5: 0.230%
Low edge DRS EVM, slot 4: 0.176%
Low edge DRS EVM, slot 5: 0.186%
High edge PUSCH EVM, slot 4: 0.260%
High edge PUSCH EVM, slot 5: 0.243%
High edge DRS EVM, slot 4: 0.234%
High edge DRS EVM, slot 5: 0.261%
Low edge PUSCH EVM, slot 6: 0.197%
Low edge PUSCH EVM, slot 7: 0.174%
Low edge DRS EVM, slot 6: 0.271%
Low edge DRS EVM, slot 7: 0.143%
High edge PUSCH EVM, slot 6: 0.306%
High edge PUSCH EVM, slot 7: 0.243%
High edge DRS EVM, slot 6: 0.290%
High edge DRS EVM, slot 7: 0.216%
Low edge PUSCH EVM, slot 8: 0.222%
Low edge PUSCH EVM, slot 9: 0.211%
Low edge DRS EVM, slot 8: 0.334%
Low edge DRS EVM, slot 9: 0.174%
High edge PUSCH EVM, slot 8: 0.244%
High edge PUSCH EVM, slot 9: 0.268%
High edge DRS EVM, slot 8: 0.342%
High edge DRS EVM, slot 9: 0.201%
Low edge PUSCH EVM, slot 10: 0.162%
Low edge PUSCH EVM, slot 11: 0.242%
Low edge DRS EVM, slot 10: 0.189%
Low edge DRS EVM, slot 11: 0.245%
High edge PUSCH EVM, slot 10: 0.246%
High edge PUSCH EVM, slot 11: 0.327%
High edge DRS EVM, slot 10: 0.206%
High edge DRS EVM, slot 11: 0.410%
Low edge PUSCH EVM, slot 12: 0.224%
Low edge PUSCH EVM, slot 13: 0.258%
Low edge DRS EVM, slot 12: 0.196%
Low edge DRS EVM, slot 13: 0.336%
High edge PUSCH EVM, slot 12: 0.322%
High edge PUSCH EVM, slot 13: 0.285%
High edge DRS EVM, slot 12: 0.297%
High edge DRS EVM, slot 13: 0.362%
Low edge PUSCH EVM, slot 14: 0.213%
Low edge PUSCH EVM, slot 15: 0.223%
Low edge DRS EVM, slot 14: 0.314%
Low edge DRS EVM, slot 15: 0.189%
High edge PUSCH EVM, slot 14: 0.232%
High edge PUSCH EVM, slot 15: 0.253%
High edge DRS EVM, slot 14: 0.405%
High edge DRS EVM, slot 15: 0.251%
Low edge PUSCH EVM, slot 16: 0.187%
Low edge PUSCH EVM, slot 17: 0.256%
Low edge DRS EVM, slot 16: 0.255%
Low edge DRS EVM, slot 17: 0.326%
High edge PUSCH EVM, slot 16: 0.248%
High edge PUSCH EVM, slot 17: 0.310%
High edge DRS EVM, slot 16: 0.197%
High edge DRS EVM, slot 17: 0.409%
Low edge PUSCH EVM, slot 18: 0.205%
Low edge PUSCH EVM, slot 19: 0.213%
Low edge DRS EVM, slot 18: 0.225%
Low edge DRS EVM, slot 19: 0.191%
High edge PUSCH EVM, slot 18: 0.304%
High edge PUSCH EVM, slot 19: 0.261%
High edge DRS EVM, slot 18: 0.335%
High edge DRS EVM, slot 19: 0.264%
Averaged low edge PUSCH EVM, frame 0: 0.214%
Averaged high edge PUSCH EVM, frame 0: 0.269%
Averaged PUSCH EVM frame 0: 0.269%
Averaged DRS EVM frame 0: 0.297%
Averaged overall PUSCH EVM: 0.269%
Averaged overall DRS EVM: 0.297%
Decode transmitted subframes and check CRC.
Subframe 0: CRC passed
Subframe 1: CRC passed
Subframe 2: CRC passed
Subframe 3: CRC passed
Subframe 4: CRC passed
Subframe 5: CRC passed
Subframe 6: CRC passed
Subframe 7: CRC passed
Subframe 8: CRC passed
Subframe 9: CRC passed
Selected Bibliography
3GPP TS 36.101 "User Equipment (UE) radio transmission and reception"