Manually Label ROIs in Multispectral Image
This example shows how to manually select regions of interest (ROIs) from a multispectral image and save them in a shapefile.
This example requires the Hyperspectral Imaging Library for Image Processing Toolbox™. You can install the Hyperspectral Imaging Library for Image Processing Toolbox from Add-On Explorer. For more information about installing add-ons, see Get and Manage Add-Ons. The Hyperspectral Imaging Library for Image Processing Toolbox requires desktop MATLAB®, as MATLAB® Online™ and MATLAB® Mobile™ do not support the library.
Many supervised learning applications require labeled training data. This example shows how to manually label multispectral or hyperspectral images by selecting ROIs and saving them in a shapefile. You can use the shapefile to train deep learning networks.
In this example, you perform these steps:
Read a multispectral image and select multiple ROIs.
Convert the ROIs into geographic coordinates.
Save the geographic coordinates of the ROIs in a shapefile.
Read the shapefile and visualize the ROIs in a geographic axes.
Load Multispectral Data
Landsat 8 is an Earth observation satellite that carries the Operational Land Imager (OLI) and Thermal Infrared Sensor (TIRS) instruments.
The Landsat 8 data set has 11 spectral bands with wavelengths that range from 440 nm to 2200 nm.
Download the data set and unzip the file by using the downloadLandsat8Dataset helper function. The helper function is attached to this example as a supporting file.
zipfile = "LC08_L1TP_113082_20211206_20211215_02_T1.zip";
landsat8Data_url = "https://ssd.mathworks.com/supportfiles/image/data/" + zipfile;
downloadLandsat8Dataset(landsat8Data_url,pwd)
Downloading the Landsat 8 OLI dataset.
This can take several minutes to download...
Done.
Read the Landsat 8 multispectral data into the workspace.
filepath = fullfile("LC08_L1TP_113082_20211206_20211215_02_T1","LC08_L1TP_113082_20211206_20211215_02_T1_MTL.txt");
mcube = geomulticube(filepath);
Estimate an RGB image from the data cube by using the colorize function. Apply contrast stretching to enhance the contrast of the output RGB image.
rgbImg = colorize(mcube);
Adjust the intensity values of the image for better visualization using the imadjustn function.
rgbImg = imadjustn(rgbImg);
Read the spatial referencing information for the Landsat 8 data from the corresponding GeoTIFF image.
filename = fullfile("LC08_L1TP_113082_20211206_20211215_02_T1","LC08_L1TP_113082_20211206_20211215_02_T1_B1.TIF");
info = georasterinfo(filename);
Calculate the data region using the corner coordinates of the GeoTIFF image.
R = info.RasterReference;
xlimits = R.XWorldLimits;
ylimits = R.YWorldLimits;
dataRegion = mappolyshape(xlimits([1 1 2 2 1]),ylimits([1 2 2 1 1]));
dataRegion.ProjectedCRS = R.ProjectedCRS;
Select ROIs and Save in Shapefile
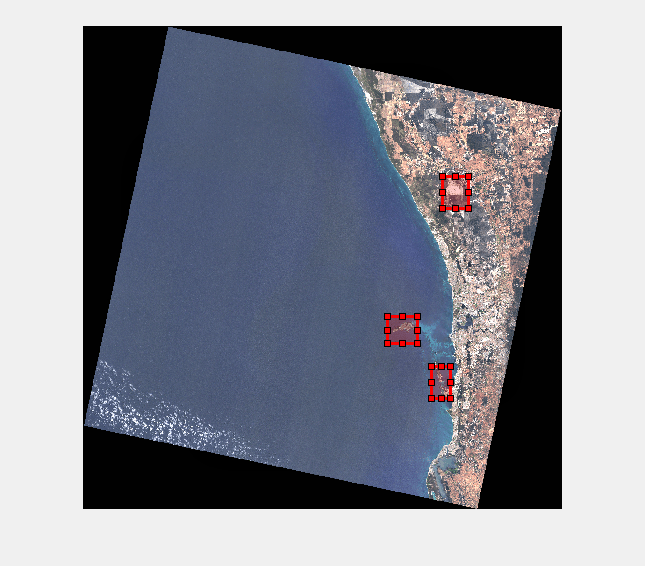
Specify the number of ROIs to select. For this example, select three ROIs.
numOfAreas = 3;
Visualize the estimated RGB image. Use the pickPolyshape helper function, defined at the end of this example, to select rectangular ROIs and store the x- and y-coordinates of the ROIs in the cell arrays polyX and polyY, respectively.
figure
imshow(rgbImg)
polyX = cell(numOfAreas,1);
polyY = cell(numOfAreas,1);
for ch = 1:numOfAreas
    [x,y] = pickPolyshape(R);
    polyX{ch} = x;
    polyY{ch} = y;
end

Create ROI shapes from the ROI coordinates by using the mappolyshape (Mapping Toolbox) function.
shape = mappolyshape(polyX,polyY);
shape.ProjectedCRS = R.ProjectedCRS;
Create a geospatial table from the ROI shapes.
gt = table(shape,VariableNames="Shape");Write the ROI shapes to the shapefile format. You can use this shapefile as labeled data.
shapewrite(gt,"Landsat8ROIs.shp")Read Shapefile and Visualize ROIs in Geographic Axes
Read the shapefile as a geospatial table.
S = readgeotable("Landsat8ROIs.shp");
S.Shape.ProjectedCRS = R.ProjectedCRS;
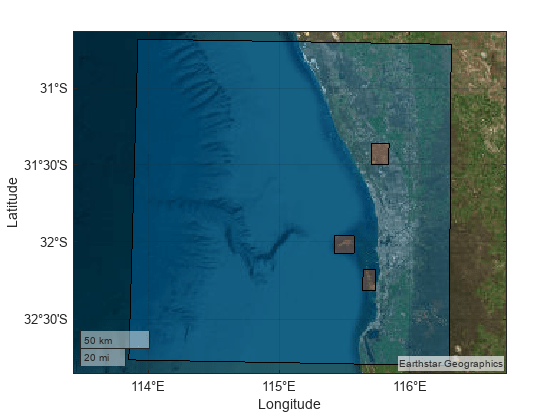
Visualize the ROIs in a geographic axes along with the data region of the Landsat 8 multispectral image.
figure
geoplot(dataRegion)
hold on
geobasemap satellite
geoplot(S)

Supporting Functions
The pickPolyshape helper function performs these tasks:
Creates a customizable rectangular ROI.
Calculates the x- and y-coordinates of the corners of the ROI.
Transforms the intrinsic coordinates of the ROI to world coordinates.
function [xWorld,yWorld] = pickPolyshape(R)
    roi = drawrectangle(Color="r");
    x1 = roi.Position(1);
    y1 = roi.Position(2);
    x2 = x1 + roi.Position(3);
    y2 = y1 + roi.Position(4);
    [xWorld,yWorld] = intrinsicToWorld(R,[x2 x1 x1 x2 x2],[y1 y1 y2 y2 y1]);
end