Pressure Reducing Valve Test Harness
This example shows how to model, parameterize, and test a pressure reducing valve. The model is used to generate a plot of the regulation curve i.e. a plot of flow vs regulated pressure. This plot can be compared with the characteristics from the manufacturer datasheet to verify the test harness. The regulation curve displays two valve functions namely the reducing function and the relieving function. The reducing valve remains open when the pressure at the secondary port is less than a specified pressure, known as the set pressure. When the pressure at the secondary port meets or surpasses the set pressure, the reducing valve closes. In the regulation curve, the region of positive flow represents the phase when the reducing valve is open and gradually closes. The pressure reducing valve used in this example has a check valve that relieves pressure when the secondary pressure is about to surpass the set pressure. During this phase, the hydraulic fluid escapes via the check valve to the primary port keeping the secondary pressure constant at the set pressure. The region of negative flow in the regulation curve represents the phase when the pressure reducing valve is closed and the check valve opens gradually. Pressure reducing valves are used in industry to limit and maintain pressure during operations like hydraulic pressing, punching, drilling and stamping.
Model
The following figure shows the model of a pressure reducing valve. The primary port of the valve is connected to a pressure source that receives a constant input. The pressure source here represents a pump or prime mover which is connected to a reservoir. The pressure at the secondary port is gradually increased with a ramp input. The drain port is connected to a reservoir. This model represents a direct acting pressure reducing valve with an external drain and a check valve.
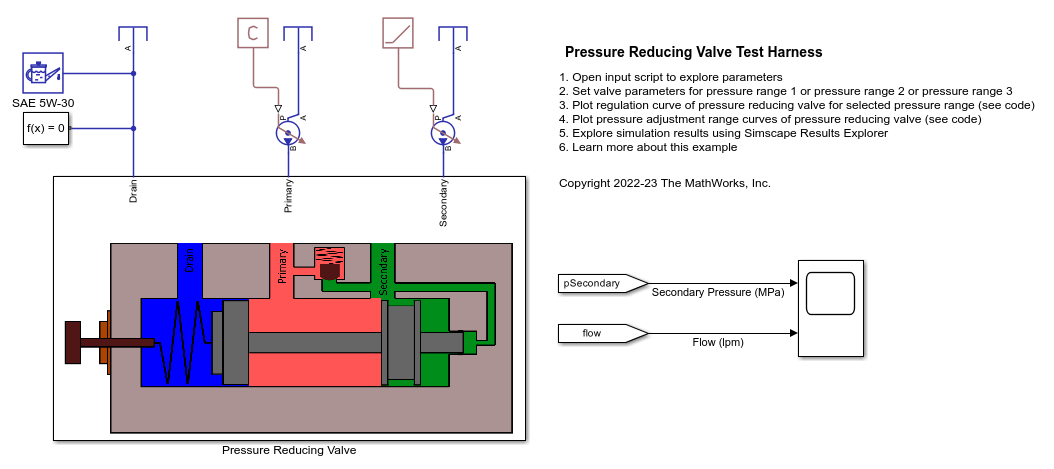
Pressure Reducing Valve Subsystem
A pressure reducing valve uses a spring-loaded spool to control the downstream pressure or the secondary pressure. If the secondary pressure is below the valve set pressure, fluid flows freely from the primary side to the secondary side. An internal passage transmits the fluid pressure from secondary side to the rightmost spool piston face. This pressure is called pilot pressure. The force due to pilot pressure opposes the spring load on the leftmost piston face. The spring may be preloaded and the preload can be adjusted with a handle or adjusting screw. The spring end of the spool is connected to a drain. When the secondary pressure reaches the set pressure, the spool quickly moves to close the secondary port and thus limits and maintains secondary pressure to the set value.

The pressure reducing valve test harness model is parameterized for different pressure adjustment ranges provided by the manufacturer. Each such adjustment setting is achieved by turning the handle or screw attached to the spring to the desired extent. The stroke length of the spool is different for each such setting. To determine the stroke length, the following equations have been used.

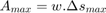
where,
 is the maximum flow rate of the pressure reducing valve
 is the coefficient of discharge
 is the maximum opening area of the spool orifice
 is the pressure differential between the primary port and the secondary port at maximum flow
 is the fluid density
 is the spool orifice width
 is the spool stroke length
The values of , , are derived from the manufacturer datasheet. The value of is assumed to be 0.64. The spring constant of the reducing valve is chosen such that the slope of the simulation output regulation curve matches that of the datasheet. The spring preload is chosen such that the secondary pressure at the maximum flow of the simulation output regulation curve matches with the datasheet.
The model assumes that the flow forces due to fluid inertia and friction are negligible. The leakage area of the spool orifice is also assumed and may not match with the manufacturer data. The simulation output regulation curve does not match perfectly with the manufacturer datasheet due to certain ambiguity regarding the exact test setup and the above factors.
Simulation Results from Simscape Logging
The model can be used to generate a plot of the regulation curve or a plot of flow vs regulated pressure for the selected pressure adjustment range. This plot can be compared with the characteristics from the manufacturer datasheet to verify the test harness using the PressureReducingValveTestHarnessReducingCharacteristics script. The below figure shows the regulation curve for the first pressure adjustment range.

The model can be used to generate a plot of the secondary pressure variation with the flow for three pressure adjustment ranges. This plot can be compared with the characteristics from the manufacturer datasheet using the PressureReducingValveTestHarnessAdjustmentRangeCharacteristics script.

See Also
Spool Orifice (IL) | Orifice (IL)