Cluster Data Using Clustering Tool
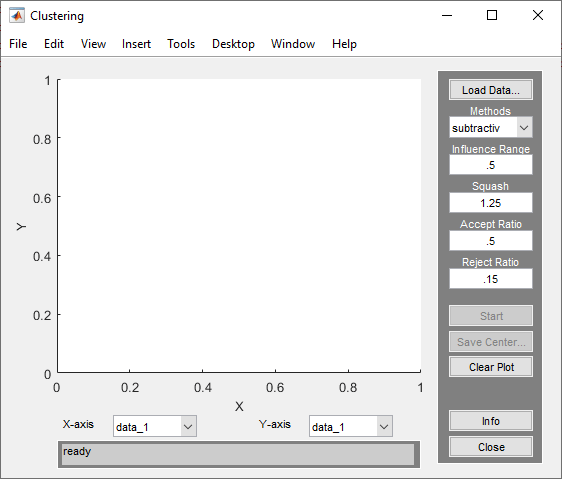
Using the Clustering tool, you can cluster data using fuzzy c-means or subtractive clustering. For more information on the clustering methods, see Fuzzy Clustering.
To open the tool, at the MATLAB® command line, type:
findcluster

Use the Clustering tool to perform the following tasks:
Load and plot the data.
Perform the clustering.
Save the cluster center.
Load and Plot Data
To load a data set, perform either of the following actions:
Click Load Data, and select the file containing the data.
Open the Clustering Tool with a data set directly by calling
findclusterwith the data set as an input argument.For example, enter:
findcluster('clusterdemo.dat')
The data set file must have the extension .dat. Each line of
the data set file contains one data point. For example, if you have 5-dimensional
data with 100 data points, the file contains 100 lines, and each line contains five
values.
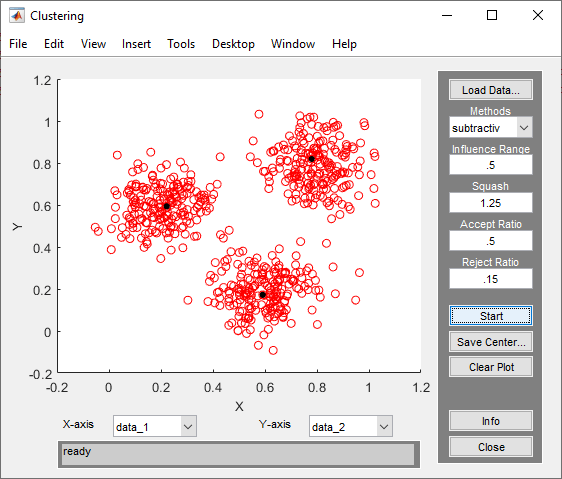
The Clustering tool works on multidimensional data sets, but displays only two of those dimensions on the plot. To select other dimensions in the data set for plotting, use the X-axis and Y-axis drop-down lists.
Cluster Data
To start clustering the data:
Choose the clustering function
fcm(fuzzy C-Means clustering) orsubtractiv(subtractive clustering) from the drop-down menu under Methods.Set options for:
Fuzzy c-means clustering using the Cluster Num, Max Iteration, Min, and Exponent fields. For information on these options, see
fcm.Subtractive clustering using the Influence Range, Squash, Aspect Ratio, and Reject Ratio fields. To use a different influence range for each data column, specify Influence Range as a vector with the number of elements equal to the number of columns. For information on these options, see
subclust.
Cluster the data by clicking Start.
Once the clustering is complete, the cluster centers appear in black.

Tip
Using the Clustering tool, you can obtain only the computed cluster centers. To obtain additional information for:
To use the same clustering data with either fcm or
subclust, first load the data file into the MATLAB workspace. For example, at the MATLAB command line, type:
load clusterdemo.datSave Cluster Centers
To save the cluster centers, click Save Center.
See Also
findcluster | fcm | subclust
