Remove Instrumentation Overheads from Execution Time Measurements
To improve execution-time profiling of generated code that runs on deterministic hardware, you can run processor-in-the-loop (PIL) simulations that automatically filter the overheads associated with code instrumentation. You can use the target hardware to estimate the average overhead value or you can specify the value manually.
Note
By default, the software filters the execution times of AUTOSAR Runtime Environment (RTE) code and functions that run within Simulink®, for example, Function Caller blocks.
Approach for Estimating and Removing Instrumentation Overhead
When you set up target connectivity for PIL simulations, you can specify objects or functions for estimating and removing instrumentation overheads from execution-time measurements.
You can:
Set up a benchmark program that Simulink runs a specified number of times at the start of a PIL simulation. The benchmark program estimates the overheads for the timer API and for timer freezing and unfreezing, task, and function instrumentation code. Simulink obtains average values for the instrumentation overheads.
Manually specify instrumentation overhead values.
During the PIL simulation, Simulink subtracts the instrumentation overhead values from the execution-time measurements. The Simulation Data Inspector and the code execution profiling report display the corrected measurement values.
This figure shows how the uncorrected and corrected timer values correspond to invocations of code sections.
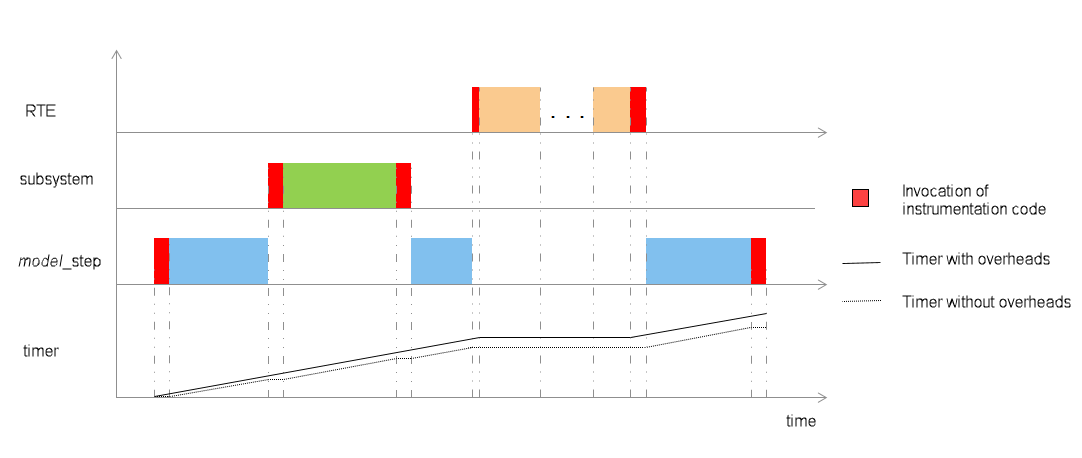
The corrected timer value excludes execution time associated with instrumentation code, RTE code, and function code that runs within Simulink.
To estimate and remove instrumentation overheads from execution-time measurements:
If PIL connectivity is set up by using the
targetnamespace, use overhead classes from the target namespace.If PIL connectivity is set up by using the
rtw.connectivity.Configclass, use functions from the class.
Remove Instrumentation Overheads by Using target Namespace
To provide the software with instrumentation overhead values, use one of these methods:
Set up the benchmark program that estimates overhead values.
Using overhead classes, manually specify overhead values.
Set Up Benchmark Program
When you set up target connectivity, implement these steps:
Retrieve the
target.Processorandtarget.Timerobjects.processor = target.get('Processor', myProcessorObjectId); timer = target.get('Timer', myTimerObjectId);
Create a
target.ProfilingTaskOverheadobject.taskOverhead = target.create('ProfilingTaskOverhead', ... 'Name', 'Timer Task Overhead'); taskOverhead.Counter = timer; taskOverhead.MinimumBenchmarkIterations = 150;
Associate the overhead values with the processor.
processor.Overheads = taskOverhead;
Specify Overhead Values
When you set up target
connectivity, create overhead class objects and use the Value
property to specify your value for the corresponding instrumentation overhead.
Retrieve the
target.Processorandtarget.Timerobjects.processor = target.get('Processor', myProcessorObjectId); timer = target.get('Timer', myTimerObjectId);
Create a
target.ProfilingTaskOverheadobject.taskOverhead = target.create('ProfilingTaskOverhead',... 'Name', 'Timer Task Overhead'); taskOverhead.Value = 10; taskOverhead.Counter = timer;
Create a
target.ProfilingFunctionOverheadobject.functionOverhead = target.create('ProfilingFunctionOverhead',... 'Name', 'Timer Function Overhead'); functionOverhead.Value = 20; functionOverhead.Counter = timer;
Create a
target.ProfilingFreezingOverheadobject.freezingOverhead = target.create('ProfilingFreezingOverhead',... 'Name', 'Timer Freezing Overhead'); freezingOverhead.Value = 30; freezingOverhead.Counter = timer;
Associate the overhead values with the processor.
processor.Overheads = ...
 [taskOverhead, functionOverhead, freezingOverhead];
Remove Instrumentation Overheads by Using Functions from rtw.connectivity.Config
The rtw.connectivity.Config class provides these functions for the
removal of instrumentation overheads.
| Function | Description |
|---|---|
|
|
|
|
|
|
|
|
|
|
|
|
|
|
|
|
When you set up target connectivity for PIL simulations,
configure the removal of the instrumentation overheads through an rtw.connectivity.Config subclass. For example, this code shows how you can run
the benchmark
program.
classdef overheadConnectivityConfig < rtw.connectivity.Config
  methods
    function this = customConnectivityConfig(componentArgs)

      % Create builder
      targetApplicationFramework = ...
        mypil.TargetApplicationFramework(componentArgs);
      builder = rtw.connectivity.MakefileBuilder(componentArgs, ...
        targetApplicationFramework, '');

      % Create launcher
      launcher = mypil.Launcher(componentArgs, builder);

      % Set up communication
      hostCommunicator = rtw.connectivity.RtIOStreamHostCommunicator(...
                         componentArgs, ...
                         launcher, ...
                         rtiostreamLibTCPIP);

      % Call super class constructor to register components
        this@rtw.connectivity.Config(componentArgs,...
                                     builder,...
                                     launcher,...
                                     hostCommunicator);

      % Register hardware-specific timer, which enables
      % code execution profiling. This example uses a
      % timer for the host platform.
      timer = coder.profile.crlHostTimer();
      this.setTimer(timer);

      % Specify removal of profiling instrumentation overheads
      this.activateOverheadFiltering(true);
      this.runOverheadBenchmark(true);
      this.setOverheadBenchmarkSteps(50);

    end
  end
end
Instead of running the benchmark program, you can use setOverheads to
provide your values for instrumentation
overheads.
    ...

    % Remove instrumentation overhead using manually specified values
    this.activateOverheadFiltering(true);
    this.setOverheads (taskInstrumentationOverhead, ...
      functionInstrumentationOverhead, freezingInstrumentation);

    ...
Retrieve Benchmark Results
When a PIL simulation is complete, you can retrieve benchmark results from the variable
that you specify in the Code Generation > Verification > Workspace variable field (CodeExecutionProfileVariable), for example,
myExecutionProfile.
benchmarkResults = myExecutionProfile.getOverheadBenchmarkData();
benchmarkResults is a structure that contains code
instrumentation overhead
values.
>> benchmarkResults
 ans =
 struct with fields:
 TimestampOverhead: [1×1 struct]
 TaskOverhead: [1×1 struct]
 FunctionOverhead: [1×1 struct]
 FreezingOverhead: [1×1 struct]

>> benchmarkResults.TaskOverhead
 ans =
 struct with fields:
 Data: [1×100 uint64]
 NumSamples: 100
 Average: 45.2800
See Also
rtw.connectivity.Config | target | target.ProfilingTaskOverhead | target.ProfilingFunctionOverhead | target.ProfilingFreezingOverhead