Localization Correction Using Traffic Sign Data from HERE HD Maps
This example shows how to use the traffic sign data from the HERE HD Live Map (HERE HDLM) service to correct the GPS measurements collected by an autonomous vehicle.
Overview
HERE HDLM data contains highly detailed and accurate information about the vehicle environment, such as road and lane topology, and is suitable for developing automated driving applications. For an overview of the data that is accessible from HERE HDLM layers, see HERE HD Live Map Layers. This example focuses on the HD Localization Model layer, which contains precise and dense information about traffic signs. You can improve localization accuracy by combining this information with live detections of traffic signs from onboard sensors. This example demonstrates a simplified solution in which you retrieve road sign location data and then use it to correct GPS readings. A more complete solution uses such data as landmarks in a landmark-based simultaneous localization and mapping (SLAM) pipeline.
In this example, you learn how to:
Read and process traffic sign information from HERE HDLM data using a GPS sequence.
Match traffic signs detected by the onboard lidar and camera sensors with the signs stored in the HERE HDLM data.
Compute the position error by comparing known sign locations in HERE HDLM to GPS-returned locations, and correct the localization results.
Load Sensor Data
The vehicle sensor data used in this example has been recorded to a rosbag using ROS. The example includes only a snippet of the rosbag to show how to extract, synchronize, and postprocess the data. To streamline localization correction, the rest of the example uses the post-processed data stored in MAT files.
% Download sensor data
baseDownloadURL = 'https://ssd.mathworks.com/supportfiles/vision/data/localizationAutonomousCarDataset.zip';
dataFolder = fullfile(tempdir,'localizationAutonomousCarDataset',filesep);
options = weboptions('Timeout',Inf);
zipFileName = [dataFolder,'localizationAutonomousCarDataset.zip'];
folderExists = exist(dataFolder,'dir');

% Create a folder in a temporary directory to save the downloaded file
if ~folderExists
    mkdir(dataFolder)
    disp('Downloading localizationAutonomousCarDataset.zip (1.01 GB). This download can take a few minutes.')
    websave(zipFileName, baseDownloadURL, options);

    % Extract contents of the downloaded file
    disp('Extracting localizationAutonomousCarDataset.zip (1.01 GB) ...')
    unzip(zipFileName, dataFolder)
end

% Extract data from a rosbag (requires ROS Toolbox)
readRosbagData = false;
hasROSToolbox = license('test','ros_toolbox');
if readRosbagData && hasROSToolbox
    filepath = [dataFolder,'\rosbag\demoRosbag.bag'];
    % helperReadRosbag uses a small rosbag sample to show how a larger
    % rosbag can be processed.  An entire data set is loaded below from MAT files.
    [ptCloudsRosbag, imgsRosbag, gpsRosbag] = helperReadRosbag(filepath);
end

% Load synchronized sensor data directly from MAT files. This data was
% extracted from a much larger rosbag collected using an autonomous car.
imgs = load([dataFolder,'\sensor\images.mat']).imgs;    % Images
ptClouds = load([dataFolder,'\sensor\ptClouds.mat']).pcds;  % Point clouds
gps = load([dataFolder,'\sensor\gps.mat']).gps;        % GPS signals
In a complete pipeline, you first detect the traffic signs in the camera frames, and then project them onto the lidar point clouds using the lidar-camera calibration result. This projection gives you the 3-D locations of the traffic signs, which can be used to calculate the error metric based on the traffic signs detected in HERE HD map data. To simplify the processing for illustration purposes, the traffic sign data in this example has been hand-annotated using the Ground Truth Labeler app. Load the bounding boxes of the traffic signs for both the images and point clouds.
imgBBoxes = load([dataFolder,'\utility\imgBBoxes.mat']).imgBBoxes;
pcBBoxes = load([dataFolder,'\utility\pcBBoxes.mat']).pcBBoxes;
Undistort the images by using camera calibration. The calibration data has been obtained using the Camera Calibrator app.
camCalib = load([dataFolder,'\utility\calibration.mat']).calib;
intrinsics = camCalib.intrinsics;
Display one of the frames to inspect the sensor data.
% Pick a frame
frameIndex = 110;

% Display the camera image and 2-D bounding box of the traffic sign
helperDisplayCameraFrame(imgs,imgBBoxes,frameIndex,intrinsics);

% Display the point cloud and 3-D bounding box of the traffic sign
helperDisplayPointCloud(ptClouds, pcBBoxes, frameIndex);
HERE HDLM data contains links within map tiles. Load the GPS coordinates of a complete route. This route covers a link that stretches over three HDLM tiles.
gpsRoute = load([dataFolder,'\utility\gpsRoute.mat']).gps_route;Read Map Data
To read the data from the map tiles that the GPS route is on, use a hereHDLMReader object. Use of the HERE HD Live Map service requires valid HERE HDLM credentials. You need to enter into a separate agreement with HERE in order to gain access to the HDLM services and to get the required credentials (access_key_id and access_key_secret) for using the HERE Service.
% Create and configure the reader
config = hereHDLMConfiguration('hrn:here:data::olp-here-had:here-hdlm-protobuf-na-2',2291);
reader = hereHDLMReader(gpsRoute(:,1),gpsRoute(:,2),'Configuration',config);

% Read data
topologyLayer = read(reader,'TopologyGeometry');
signLayer= read(reader,'LocalizationSign');
Preprocess the data to improve the search time when querying the required data. The helper function helperProcessHDLMData, defined at the end of the example, takes the GPS route and returns the following data:
linkData— Contains all the links present in the tiles spanning the GPS route. The links are segmented into pairs of[lat, lon]coordinates.signData— Contains information about the signs available in the tiles spanning the GPS route.
[linkData,signData] = helperProcessHDLMData(config,topologyLayer,signLayer);
Localization, Traffic Sign Matching, and Error Correction
To localize the autonomous vehicle, use the GPS measurements and the links forming each road in the TopologyGeometry layer:
For each GPS location, find the closest link in the tile using the
helperFindClosestLinkfunction.Find the closest traffic sign to the vehicle position based on the
LocalizationSignlayer data. Then, match that sign to the one of the traffic signs detected by the lidar and camera.Once a traffic sign is not detected anymore, calculate the difference in position between the traffic signs detected by the lidar and camera and the traffic signs selected from the HERE HDLM data.
Apply the corrections to the previous GPS measurements.
% Initialize variables
hdlmDetectedSigns = zeros(0,2);
lidarDetectedSigns = zeros(0,2);
relevantGPS = zeros(0,2);
finalGPS = zeros(0,4);
finalSigns = zeros(0,4);
numDetections = 0;

for i = 1:numel(gps)

    gpsMeasurement = gps{i};
    pcBBox = pcBBoxes{i};

    % Find the closest link
    closestLinkID = helperFindClosestLink(linkData, gpsMeasurement);

    isSignDetected = ~isempty(pcBBox);
    if isSignDetected
        % If a traffic sign is detected by lidar and camera, find the ID of
        % the traffic sign that is closest to the current GPS position.
        distToSigns = helperDistance(gpsMeasurement(1),gpsMeasurement(2), ...
            signData(:,2),signData(:,3));
        [~,minIndex] = min(distToSigns);
        closestSignID = signData(minIndex,1);

        % Make sure that the closest traffic sign is on the closest link
        for m = 1:size(signLayer,1)
            roadToSignsRefs = signLayer(m,1).RoadToSignsReferences;

            if ismember(closestLinkID,[roadToSignsRefs.LinkRef])
                signRefs = vertcat(roadToSignsRefs.SignRefs);
                if ismember(closestSignID,[signRefs.SignId])
                    % Transform the coordinates from the lidar frame to the GPS frame
                    [lat,lon] = helperLidar2latlon(pcBBox,gps,i);

                    % Store relevant results
                    hdlmDetectedSigns = [hdlmDetectedSigns; signData(minIndex,2:3)]; %#ok<*AGROW>
                    lidarDetectedSigns = [lidarDetectedSigns; lat, lon];
                    relevantGPS = [relevantGPS; gpsMeasurement(1:2)];
                    numDetections = numDetections+1;
                    break
                end
            end
        end

    elseif numDetections > 1
        % Once a traffic sign is not detected anymore, calculate the error between
        % the traffic signs detected by the lidar and camera and the traffic signs
        % selected from the HDLM data.
        error = hdlmDetectedSigns(end,1:2) - mean(lidarDetectedSigns(:,1:2));

        % Apply the correction to the GPS coordinates reported by the GPS sensor
        correctedGPS = relevantGPS + error;

        % Store results
        finalGPS = [finalGPS; relevantGPS, correctedGPS];
        finalSigns = [finalSigns; mean(lidarDetectedSigns), hdlmDetectedSigns(end,:)];

        % Re-initialize storage variables
        numDetections = 0;
        relevantGPS = zeros(0,2);
        hdlmDetectedSigns = zeros(0,2);
        lidarDetectedSigns = zeros(0,2);
    end
end
Display Results on Map
Display the results of the localization pipeline on a map using the calculated latitude and longitude measurements.
helperDisplayResults(finalSigns,finalGPS,topologyLayer);
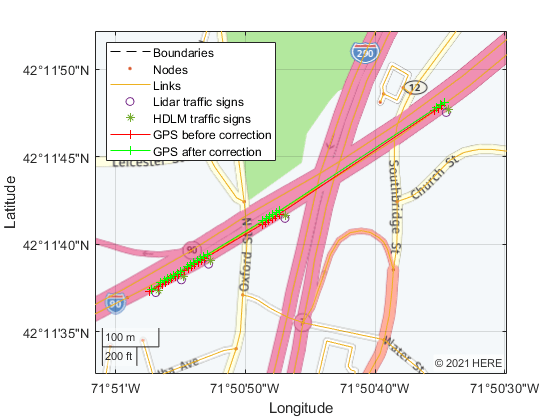
The corrected localization trace matches the lane level localization more accurately as compared to an actual drive.
Helper Functions
helperReadRosbag reads sensor data from a rosbag and outputs synchronized point clouds, images, and GPS data. It is meant to illustrate rosbag processing. In this example, it processes only a snippet of the data that is stored in the post-processed MAT files. This function requires ROS Toolbox™.
function [ptClouds, images, gps] = helperReadRosbag(filepath)

bag = rosbag(filepath);

% Names of ROS topics
lidarTopic = '/os1_cloud_node/points';
imageTopic = '/camera/image_color';
gpsTopic = '/raw_fix';

bagLidar = select(bag,'Topic',lidarTopic);
bagImage = select(bag,'Topic',imageTopic);
bagGPS = select(bag,'Topic',gpsTopic);

% Read the messages
msgStructsImage = readMessages(bagImage);
msgStructsPC = readMessages(bagLidar);
msgStructsGPS = readMessages(bagGPS);

numLidarFrames = size(bagLidar.MessageList,1);

ptClouds = cell(numLidarFrames, 1);
images = cell(numLidarFrames, 1);
gps = cell(numLidarFrames, 1);

% Since each sensor runs at a different frequency, use the
% lidar's acquisition rate as the basis for synchronizing lidar,
% video and GPS data. Collect frames from other sensors by
% selecting the closest ones according to their time stamps.
for i = 1:numLidarFrames
    timeStamp = bagLidar.MessageList.Time(i);

    % Lidar point cloud
    msgPC = msgStructsPC{i};
    ptClouds{i} = pointCloud(readXYZ(msgPC));

    % Camera data
    [~, minIdx] = min(abs(bagImage.MessageList.Time-timeStamp));
    images{i} = readImage(msgStructsImage{minIdx});

    % GPS data
    [~, minIdx] = min(abs(bagGPS.MessageList.Time-timeStamp));
    gps{i} = [msgStructsGPS{minIdx}.Latitude, ...
        msgStructsGPS{minIdx}.Longitude, ...
        msgStructsGPS{minIdx}.Altitude];
end
end
helperProcessHDLMData processes the data available in the TopologyGeometry and LocalizationSign layers used for localization.
function [linkData,signData] = helperProcessHDLMData(config,topologyLayer,signLayer)

% Collect all the links in the tiles from the TopologyGeometry layer
[linkIDs,linkGeometries] = helperCollectLinksData(config,topologyLayer);

% Divide the links into segments of two points. This gives more accurate
% results when finding the closest link for a given GPS position
linkData = helperSegmentLinks(linkIDs,linkGeometries);

% Collect all the signs in the tiles from the LocalizationSign layer
signData = helperCollectSignData(signLayer);
end
helperCollectLinksData collects relevant information on all the links that appear in the tiles.
function [linkIDs, linkGeometries] = helperCollectLinksData(config,topologyLayer)

linkIDs=[];
linkGeometries=[];

intersectLinkRefs = vertcat(topologyLayer.IntersectingLinkRefs);
tileIDs = unique(vertcat(intersectLinkRefs.LinkHereTileId));
reader = hereHDLMReader(tileIDs,'Configuration',config);
topologies = read(reader,'TopologyGeometry');

for j = 1:size(topologyLayer,1)
    % Intersecting links
    currIntersectLinkRefs = topologyLayer(j, 1).IntersectingLinkRefs;
    for i = 1:size(currIntersectLinkRefs,1)
        tileID = currIntersectLinkRefs(i).LinkHereTileId;
        linkID = currIntersectLinkRefs(i).LinkId;
        topology = topologies(tileIDs==tileID);

        linksStartingInTile = topology.LinksStartingInTile;
        linksTileID = vertcat(linksStartingInTile.LinkId);
        linkGeometry = linksStartingInTile(linksTileID==linkID).Geometry.Here2dCoordinateDiffs;
        linkIDs = [linkIDs; linkID];
        linkGeometries = [linkGeometries; {linkGeometry}];
    end

    % Links starting in tile
    linksStartingInTile = topologyLayer(j,1).LinksStartingInTile;
    for i = 1:size(linksStartingInTile,1)
        linkIDs = [linkIDs; linksStartingInTile(i).LinkId];
        linkGeometry = linksStartingInTile(i).Geometry.Here2dCoordinateDiffs;
        linkGeometries = [linkGeometries; {linkGeometry}];
    end
end
end
helperCollectSignData collects the IDs and positions of traffic signs.
function signData = helperCollectSignData(signLayer)

signData = [];
for i = 1:size(signLayer,1)
    signData = [signData; double(vertcat(signLayer(i).Signs.SignId)), ...
        vertcat(signLayer(i).Signs.Here2dCoordinate)];
end
end
helperSegmentLinks breaks up long links into shorter segments.
function linkData = helperSegmentLinks(linkIDs,linkGeometries)

linkData = zeros(0,5); % [LinkID, start_lat, start_lon, end_lat, end_lon]
for i = 1:numel(linkIDs)
    points = linkGeometries{i};
    numSegments = size(points, 1) - 1;
    linkData = [linkData; [repmat(double(linkIDs(i)),numSegments,1), ...
        points(1:numSegments, 1:2), points(2:numSegments+1, 1:2)]];
end
end
helperFindClosestLink finds the closest link to the GPS location.
function closestLinkID = helperFindClosestLink(linkData,gps)

% Compute distance to link
distToLinkStart = helperDistance(gps(1),gps(2),linkData(:, 2),linkData(:, 3));
distToLinkEnd = helperDistance(gps(1),gps(2),linkData(:, 4),linkData(:, 5));
distToLinks = min(distToLinkStart,distToLinkEnd);

% Find closest link
[~,index] = min(distToLinks);
closestLinkID = linkData(index, 1);
end
helperLidar2latlon converts coordinates from the lidar frame to the GPS frame.
function [lat,lon] = helperLidar2latlon(bbox, gps, i)
% Converts the lidar coordinates of the detected traffic sign to latitude and
% longitude measurements. This is done by first converting the lidar coordinates
% to the vehicle frame, then the East, North, Up (ENU) frame, and finally the GPS frame.

% Center of the bounding box in the lidar frame.
center = bbox(1:3);

% Calculate the bearing angle.
lon1 = gps{1,i-4}(1);
lon2 = gps{1,i}(1);
lat1 = gps{1,i-4}(2);
lat2 = gps{1,i}(2);

dLon = lon2 - lon1;
y = sin(dLon) * cos(lat2);
x = cos(lat1) * sin(lat2) - sin(lat1) * cos(lat2) * cos(dLon);
theta = atan2(y, x);

initialBearing = mod(theta + 2*pi, 2*pi);
finalBearing   = mod(initialBearing + pi/2, 2*pi);

% Transform from the lidar frame to the vehicle frame.
x = -center(1);
y = -center(2);

% Transform from the vehicle frame to the ENU frame.
e = sin(finalBearing)*x - cos(finalBearing)*y;
n = cos(finalBearing)*x + sin(finalBearing)*y;

% Transform from the ENU frame to the GPS frame.
% The origin of the ENU local frame is set to the current GPS location.
origin     = [gps{1,i}(1) gps{1,i}(2) gps{1,i}(3)];
[lat,lon] = local2latlon(e,n,0,origin);
end
helperDistance calculates the distance between two groups of GPS points.
function d = helperDistance(lat1,lon1,lat2,lon2)
numSignals = numel(lat2);
[x,y] = latlon2local(lat2,lon2,zeros(numSignals,1),[lat1 lon1 0]); % Assuming zero altitude
d = sqrt(x.^2 + y.^2);
end
helperDisplayResults displays the GPS results of the pipeline on a map. This basemap is from HERE Technologies and requires a valid license separate from your HERE HDLM license. To use this map, you must enter the Access Key ID corresponding to your HERE license.
function helperDisplayResults(finalSigns,finalGPS,topologyLayer)

% Create dialog box for entering the Access Key ID.
url = ['https://1.base.maps.ls.hereapi.com/maptile/2.1/maptile/', ...
    'newest/normal.day/${z}/${x}/${y}/256/png?apikey=%s'];

prompt = {'HERE Access Key ID:'};
title = 'HERE Tokens';

dims = [1 40]; % Text edit field height and width
hereTokens = inputdlg(prompt,title,dims);

if ~isempty(hereTokens)

    % Add HERE basemap with custom attribution.
    url = sprintf(url,hereTokens{1});
    copyrightSymbol = char(169);
    attribution = [copyrightSymbol,' ',datestr(now,'yyyy'),' HERE'];
    addCustomBasemap('herestreets',url,'Attribution',attribution);

    f = figure('Name','Corrected GPS measurements');
    gx = geoaxes("Parent",f);
    plot(topologyLayer,'Axes',gx);
    hold(gx,'on');
    legend(gx,'Boundaries','Nodes','Links','Location','northwest');

    nlat = [finalSigns(1,1) finalSigns(end,1)];
    nlon = [finalSigns(1,2) finalSigns(end,2)];
    nzoom = 16;

    geolimits(gx,nlat,nlon);
    gx.ZoomLevel = nzoom;

    geobasemap(gx,'herestreets');
    geoplot(gx,finalSigns(:,1),finalSigns(:,2),'o','DisplayName','Lidar traffic signs');
    geoplot(gx,finalSigns(:,3),finalSigns(:,4),'*','DisplayName','HDLM traffic signs');
    geoplot(gx,finalGPS(:,1),finalGPS(:,2),'r-+','DisplayName','GPS before correction');
    geoplot(gx,finalGPS(:,3),finalGPS(:,4),'g-+','DisplayName','GPS after correction');
else
    error('You must enter valid credentials to access maps from HERE Technologies');
end
end
helperDisplayCameraFrame displays one camera image with 2-D traffic sign bounding boxes.
function helperDisplayCameraFrame(imgs,imgBBoxes,frameIndex,intrinsics)

img = undistortImage(imgs{frameIndex},intrinsics);

f  = figure('Name','Camera frame');
ax = gca(f);

% Display camera frame
imshow(img,'Parent',ax);
hold(ax,'on')

showShape('rectangle',imgBBoxes{frameIndex},'Color','blue','LineWidth',2,'Parent',ax);
end
helperDisplayPointCloud displays one lidar point cloud with 3-D traffic sign bounding boxes.
function helperDisplayPointCloud(ptClouds,pcBBoxes,frameIndex)

f = figure('Name','Point cloud');
ax = gca(f);

pcshow(ptClouds{frameIndex},'Parent',ax);
hold(ax,'on')
xlabel(ax,'X')
ylabel(ax,'Y')
zlabel(ax,'Z')

xlim([-40 40])
ylim([-20 40])
zlim([-5 10])
view([90 45])

showShape('cuboid', pcBBoxes{frameIndex},'Color','red','LineWidth',2,'Parent',ax);
end