Neural Network Time-Series Utilities
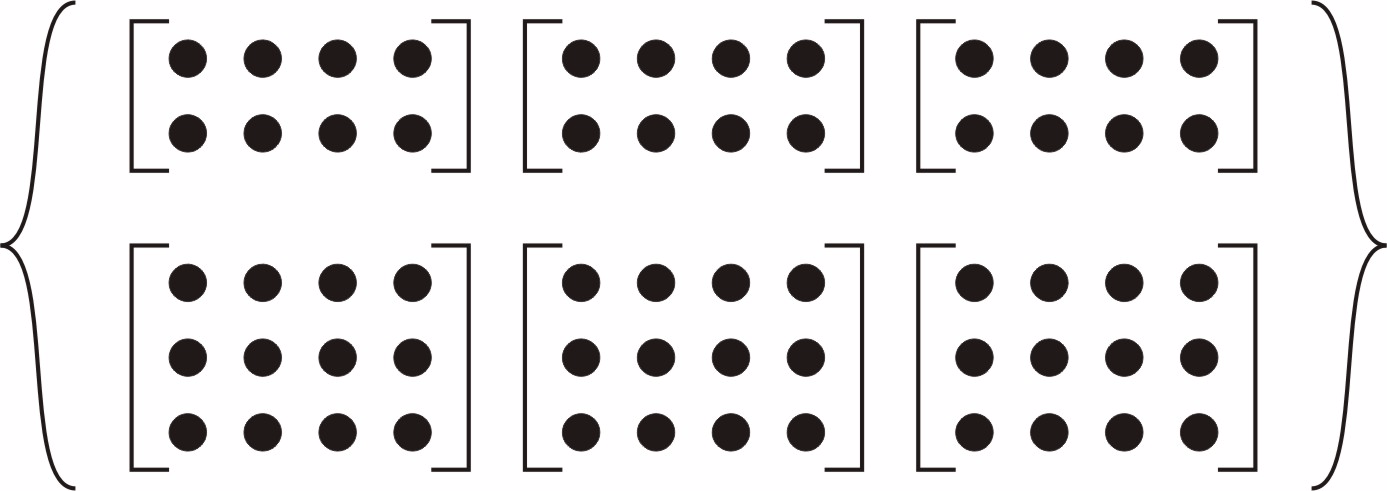
There are other utility functions that are useful when manipulating neural network data, which can consist of time sequences, concurrent batches or combinations of both. It can also include multiple signals (as in multiple input, output or target vectors). The following diagram illustrates the structure of a general neural network data object. For this example there are three time steps of a batch of four samples (four sequences) of two signals. One signal has two elements, and the other signal has three elements.

The following table lists some of the more useful toolbox utility functions for neural network data. They allow you to do things like add, subtract, multiply, divide, etc. (Addition and subtraction of cell arrays do not have standard definitions, but for neural network data these operations are well defined and are implemented in the following functions.)
| Function | Operation |
|---|---|
Add neural network (nn) data. | |
Divide nn data. | |
Select indicated elements from nn data. | |
Select indicated samples from nn data. | |
Select indicated signals from nn data. | |
Select indicated time steps from nn data. | |
Multiply nn data. | |
Take the negative of nn data. | |
Subtract nn data. | |
Create an nn data object of specified size, where values are assigned randomly or to a constant. | |
Return number of elements, samples, time steps and signals in an nn data object. | |
Return the number of elements in nn data. | |
Return the number of samples in nn data. | |
Return the number of signals in nn data. | |
Return the number of time steps in nn data. | |
Set specified elements of nn data. | |
Set specified samples of nn data. | |
Set specified signals of nn data. | |
Set specified time steps of nn data. |
There are also some useful plotting and analysis functions for dynamic networks that are listed in the following table. There are examples of using these functions in the Get Started with Deep Learning Toolbox.
Function | Operation |
|---|---|
Plot the autocorrelation function of the error. | |
Plot the crosscorrelation between the error and the input. | |
Plot network output and target versus time. |