Frequency Response Data (FRD) Models
Frequency Response Data
In the Control System Toolbox™ software, you can use frd models to store, manipulate,
and analyze frequency response data. An frd model stores a
vector of frequency points with the corresponding complex frequency response data
you obtain either through simulations or experimentally.
For example, suppose you measure frequency response data for the SISO system you want to model. You can measure such data by driving the system with a sine wave at a set of frequencies ω1, ω2, ,...,ωn, as shown:
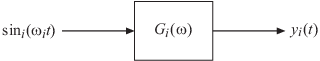
At steady state, the measured response yi(t) to the driving signal at each frequency ωi takes the following form:
The measurement yields the complex frequency response G at each input frequency:
You can do most frequency-domain analysis tasks on frd
models, but you cannot perform time-domain simulations with them.
Commands for Creating FRD Models
Use the following commands to create FRD models.
|
Command |
Description |
|---|---|
frd | Create frd objects from frequency response
data. |
frestimate (Simulink Control Design) | Create frd objects by estimating the
frequency response of a Simulink® model. This approach requires Simulink
Control Design™ software. See Offline Frequency Response Estimation (Simulink Control Design) for more
information. |
Create Frequency Response Model from Data
This example shows how to create a single-input, single-output (SISO) frequency-response model using frd.
A frequency-response model stores a vector of frequency points with corresponding complex frequency response data you obtain either through simulations or experimentally. Therefore, if you measure the frequency response of your system at a set of test frequencies, you can use the data to create a frequency response model.
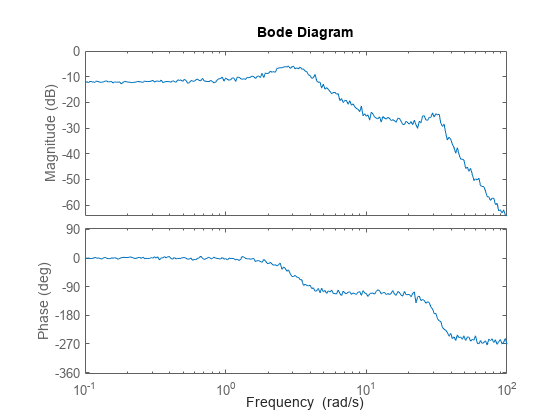
Load the frequency response data in AnalyzerData.mat.
load AnalyzerDataThis command loads the data into the MATLAB® workspace as the column vectors freq and resp. The variables freq and resp contain 256 test frequencies and the corresponding complex-valued frequency response points, respectively.
Create a frequency response model.
sys = frd(resp,freq);
sys is an frd model object that represents frequency response data.
You can use frd models with many frequency-domain analysis commands. For example, visualize the frequency response data using bode.
bode(sys)
By default, the frd function assumes that the frequencies are in radians/second. To specify different frequency units, use the TimeUnit and FrequencyUnit properties of the frd model object. For example, set the frequency units to radians/minute.
sys = frd(resp,freq,...
    "TimeUnit","min","FrequencyUnit","rad/TimeUnit");
See Also
frd | frestimate (Simulink Control Design)