Filtering in Communication Systems
Filtering tasks supported in the Communications Toolbox™ include:
Pulse shaping and matched filtering using raised cosine filters as shown in this diagram.

Reducing inter-symbol interference (ISI) that results from a nonlinear amplifier.
Shaping a signal using ideal rectangular pulses.
Implementing an integrate-and-dump operation or a windowed integrator. The receiver often uses an integrate-and-dump operation when the transmitter uses an ideal rectangular-pulse model. Integrate-and-dump can also be used in fiber optics and in spread-spectrum communication systems such as CDMA (code division multiple access) applications.
For additional filtering capabilities, see Digital and Analog Filters and Filter Design and Analysis.
Without propagation delays, raised cosine filters are noncausal, which means that the current output depends on the future input to the system. In order to design only realizable filters, implementations delay the peak response before producing an output. This delay, known as the group delay of the filter, is the time between the initial and peak response for the filter. The filter span in symbols is twice the group delay in symbols. For more information, see Group Delay.
For more background information about filters and pulse shaping, see References.
Pulse Shaping Using Raised Cosine Filter System Objects
Filter a 16-QAM signal using a pair of square root raised cosine matched filters. Plot the eye diagram and scatter plot of the signal. After passing the signal through an AWGN channel, calculate the number of bit errors.
Set the simulation and filter parameters.
M = 16;         % Modulation order
bps = log2(M);  % Bits per symbol
n = 20000;      % Transmitted bits
sps = 4;        % Samples per symbol
EbNo = 10;      % Eb/N0 (dB)
span = 10;      % Filter span in symbols
rolloff = 0.25; % Filter rolloff factor
Create the raised cosine transmit and receive filter objects using the defined parameters.
txfilter = comm.RaisedCosineTransmitFilter( ...
    RolloffFactor=rolloff, ...
    FilterSpanInSymbols=span, ...
    OutputSamplesPerSymbol=sps);

rxfilter = comm.RaisedCosineReceiveFilter( ...
    RolloffFactor=rolloff, ...
    FilterSpanInSymbols=span, ...
    InputSamplesPerSymbol=sps, ...
    DecimationFactor=sps);
Plot the impulse response of the raised cosine transmit filter object txFilter.
impz(txfilter.coeffs.Numerator)
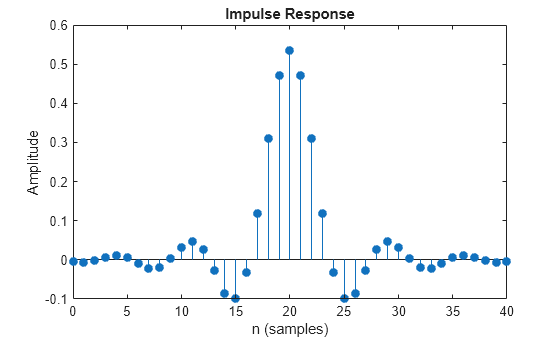
Calculate the delay through the matched filters. The group delay is half of the filter span through one filter and is, therefore, equal to the filter span for both filters. Multiply by the number of bits per symbol to get the delay in bits.
filtDelay = bps*span;
Create an error rate counter System object™. Set the ReceiveDelay property to account for the delay through the matched filters.
errorRate = comm.ErrorRate(ReceiveDelay=filtDelay);
Generate binary data.
x = randi([0 1],n,1);
Modulate the data.
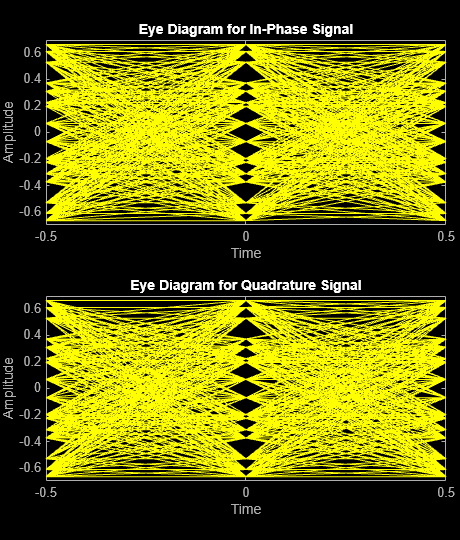
modSig = qammod(x,M,InputType="bit");Filter the modulated signal, and then plot the eye diagram of the first 1000 samples.
txSig = txfilter(modSig);
eyediagram(txSig(1:1000),sps)
Calculate the signal-to-noise ratio (SNR) in dB given . Pass the transmitted signal through the AWGN channel using the awgn function.
SNR = convertSNR(EbNo,"ebno","snr", ...
    SamplesPerSymbol=sps, ...
    BitsPerSymbol=bps);
noisySig = awgn(txSig,SNR,"measured");
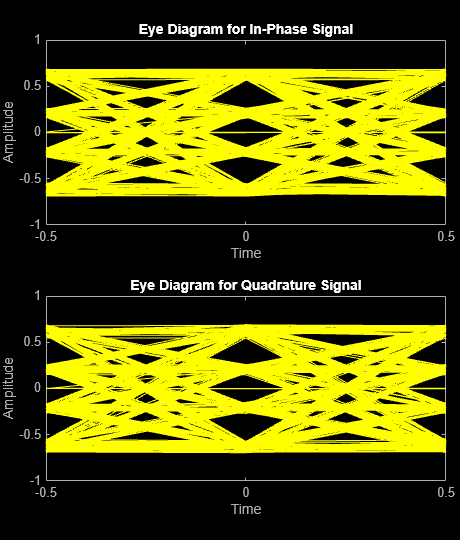
Filter the noisy signal, and then display its eye diagram and scatter plot.
rxSig = rxfilter(noisySig);
eyediagram(rxSig(1:1000),sps)
scatterplot(rxSig)

Demodulate the filtered signal and calculate the error statistics. The delay through the filters is accounted for by the ReceiveDelay property in errorRate.
z = qamdemod(rxSig,M,OutputType="bit");

errStat = errorRate(x,z);
fprintf('\nBER = %5.2e\nBit Errors = %d\nBits Transmitted = %d\n',...
    errStat)
BER = 1.15e-03
Bit Errors = 23
Bits Transmitted = 19960
nzmod = awgn(modSig,SNR,"measured");
demodsig = qamdemod(nzmod,M,OutputType="bit");
errorRate2 = comm.ErrorRate;
errStat2 = errorRate2(x,demodsig);
fprintf('\nBER = %5.2e\nBit Errors = %d\nBits Transmitted = %d\n',...
    errStat2)
BER = 5.86e-02
Bit Errors = 1172
Bits Transmitted = 20000
Reduce ISI Using Raised Cosine Filtering
Employ raised cosine filtering to reduce inter-symbol interference (ISI) that results from a nonlinear amplifier.
Initialize a simulation variable for modulation order.
M = 16; % Modulation orderCreate square root raised cosine filter objects.
txfilter = comm.RaisedCosineTransmitFilter;
rxfilter = comm.RaisedCosineReceiveFilter;
Create a memoryless nonlinearity System object™ to introduce nonlinear behavior to the modulated signal. Using name-value pairs, set the Method property to Saleh model to emulate a high power amplifier.
hpa = comm.MemorylessNonlinearity('Method','Saleh model', ...
    'InputScaling',-10,'OutputScaling',0);
Generate random integers and apply 16-QAM modulation.
x = randi([0 M-1],1000,1);
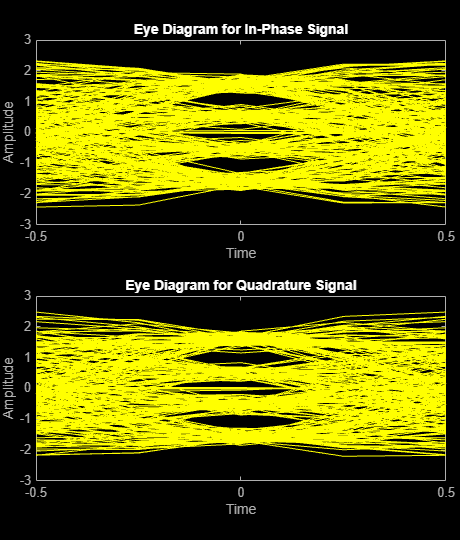
modSig = qammod(x,M,'UnitAveragePower',true);Plot the eye diagram of the modulated signal. At time 0, there are three distinct "eyes" for 16-QAM modulation.
eyediagram(modSig,2)
Amplify the modulated signal using hpa.
txSigNoFilt = hpa(modSig);
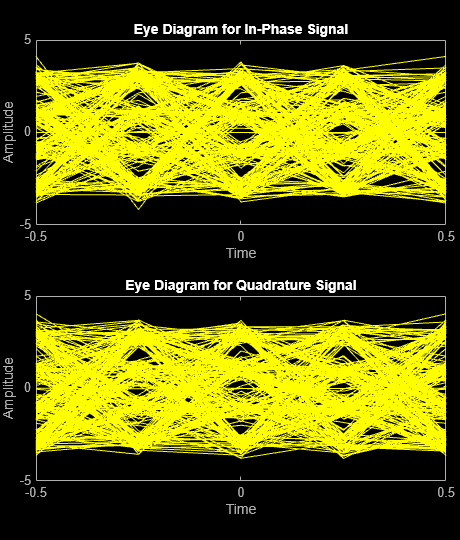
Plot the eye diagram of the amplified signal without RRC filtering. At time 0, there are multiple eyes. This is a result of inter-symbol interference from the nonlinear amplifier.
eyediagram(txSigNoFilt,2)
Filter the modulated signal using the RRC transmit filter.
filteredSig = txfilter(modSig);
Release hpa and amplify the filtered signal. The release function is needed because the input signal dimensions change due to filter interpolation.
release(hpa)
txSig = hpa(filteredSig);
Filter txSig using the RRC matched receive filter.
rxSig = rxfilter(txSig);
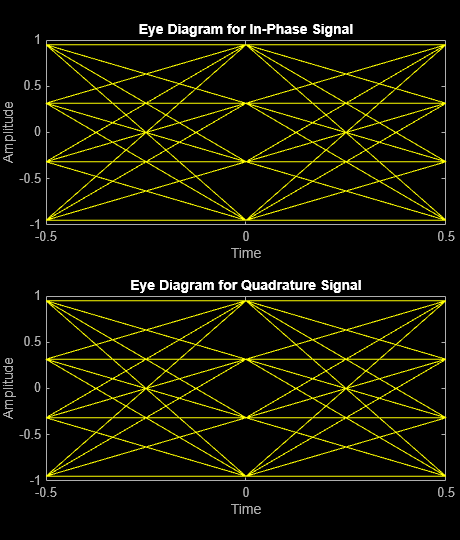
Plot the eye diagram of the signal after the application of the receive filter. There are once again three distinct eyes as the matched RRC filters mitigate ISI.
eyediagram(rxSig,2)
Find Delay for Encoded and Filtered Signal
Determine the delay for a convolutionally encoded and filtered link. Use the delay to accurately determine the number of bit errors.
Create a QPSK modulator and demodulator pair. Specify the objects to operate on bits.
qpskmod = comm.QPSKModulator(BitInput=true);
qpskdemod = comm.QPSKDemodulator(BitOutput=true);
Create a raised cosine transmit and receive filter pair.
txfilt = comm.RaisedCosineTransmitFilter;
rxfilt = comm.RaisedCosineReceiveFilter;
Create a convolutional encoder and Viterbi decoder pair.
convEnc = comm.ConvolutionalEncoder;
vitDec = comm.ViterbiDecoder(InputFormat='Hard');
Generate random binary data. Convolutionally encode the data.
txData = randi([0 1],1000,1);
encData = convEnc(txData);
Modulate the encoded data. Pass the modulated data through the raised cosine transmit filter.
modSig = qpskmod(encData);
txSig = txfilt(modSig);
Pass the filtered signal through an AWGN channel.
rxSig = awgn(txSig,20,'measured');Filter and then demodulate the received signal.
filtSig = rxfilt(rxSig);
demodSig = qpskdemod(filtSig);
Decode the demodulated data.
rxData = vitDec(demodSig);
Find the delay between the transmitted and received binary data by using the finddelay function.
td = finddelay(txData,rxData)
td = 44
Confirm that the computed delay matches the expected delay, which is equal to the sum of the group delay of the matched filters and the traceback depth of the Viterbi decoder.
tdexpected = ( ...
    txfilt.FilterSpanInSymbols + rxfilt.FilterSpanInSymbols)/2 + ...
    vitDec.TracebackDepth;
isequal(td,tdexpected)
ans = logical
   1
Calculate the number of bit errors by discarding the last td bits from the transmitted sequence and discarding the first td bits from the received sequence.
numErrors = biterr(txData(1:end-td),rxData(td+1:end))
numErrors = 0
Design Raised Cosine Filters in Simulink
This example illustrates a typical setup in which a transmitter uses a square root raised cosine filter to perform pulse shaping and the corresponding receiver uses a square root raised cosine filter as a matched filter. The example plots an eye diagram from the filtered received signal.

The doc_rcfilters model applies RRC filtering to a 16QAM modulated signal, adds AWGN to the signal, and displays the eye diagram.
The Random Integer Generator block sets M-ary number to
16, Sample time to1/100, Samples per frame to100, and selects Frame-based outputs.The Rectangular QAM Modulator Baseband block sets Normalization method to
Peak Power, and Peak power to1.The Raised Cosine Transmit Filter block sets Filter span in symbols to 8, and Rolloff factor to 0.2.
The AWGN Channel block sets Mode to
Signal to noise ratio (SNR), SNR to40, and Input signal power to0.0694. The power gain of a square-root raised cosine transmit filter is 1 / N, where N represents the upsampling factor of the filter. The input signal power of filter is 0.5556. A 16-QAM rectangular modulator peak power setting of 1 watt, translates to an average power of 0.5556. Therefore, the output signal power of filter is (0.5556/8) = 0.0694.The Raised Cosine Receive Filter block sets Filter span in symbols to 8, and Rolloff factor to 0.2
The Eye Diagram block sets Symbols per trace to 2, and Traces to display to 100.
Running the simulation produces an eye diagram. The large signal-to-noise ratio in this example produces an eye diagram with large eye openings. If you decrease the SNR parameter in the AWGN Channel block, the eyes in the diagram will close more. In the eye diagram, the two widely opened "eyes" indicate appropriate instants at which to sample the filtered signal before demodulating and illustrates the absence of intersymbol interference at the sampling instants of the received waveform.

Design Raised Cosine Filters Using MATLAB Functions
The rcosdesign function designs finite impulse response (FIR) raised cosine (RC) and square-root raised cosine (RRC) filters. The function returns the FIR coefficients as output. To apply filtering to a signal use the upfirdn function with the coefficients returned by rcosdesign.
Design a square-root raised cosine FIR filter with a roll-off of 0.25, a filter span of 6 symbols, and an oversampling factor of 2.
sps = 2;
num = rcosdesign(0.25,6,sps);
num(1:6)
ans = 1×6

   -0.0265    0.0462    0.0375   -0.1205   -0.0454    0.4399
num(7:end)
ans = 1×7

    0.7558    0.4399   -0.0454   -0.1205    0.0375    0.0462   -0.0265
Here, the vector num contains the coefficients of the filter, in ascending order of powers of .
Use the upfirdn function to filter data with a raised cosine filter generated by rcosdesign. The eye diagram shows an imperfect eye because num characterizes a square-root filter.
d = 2*randi([0 1],100,1)-1;
f = upfirdn(d,num,sps);
eyediagram(f(7:200),sps)

Interpolate and Decimate Using RRC Filter
This example shows how to interpolate and decimate signals using square-root, raised cosine filters designed with the rcosdesign function.
Define the square-root raised cosine filter parameters. Define the signal constellation parameters.
rolloff = 0.25; % Filter rolloff
span = 6;       % Filter span
sps = 4;        % Samples per symbol
M = 4;          % Size of the signal constellation
k = log2(M);    % Number of bits per symbol
Generate the coefficients of the square-root raised cosine filter using the rcosdesign function.
rrcFilter = rcosdesign(rolloff,span,sps);
Generate 10000 data symbols using the randi function.
data = randi([0 M-1],10000,1);
Apply PSK modulation to the data symbols. Because the constellation size is 4, the modulation type is QPSK.
modData = pskmod(data,M,pi/4);
Using the upfirdn function, upsample and filter the input data.
txSig = upfirdn(modData,rrcFilter,sps);
Convert the Eb/N0 to SNR and then pass the signal through an AWGN channel.
EbNo = 7;
snr = convertSNR(EbNo,'ebno','snr', ...
    SamplesPerSymbol=sps, ...
    BitsPerSymbol=k);
rxSig = awgn(txSig,snr,'measured');
Filter and downsample the received signal. Remove a portion of the signal to account for the filter delay.
rxFilt = upfirdn(rxSig,rrcFilter,1,sps);
rxFilt = rxFilt(span+1:end-span);
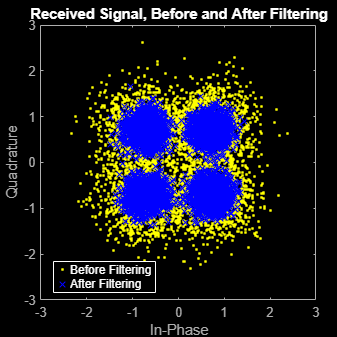
Create a scatterplot of the modulated data using the first 5000 symbols.
hScatter = scatterplot(sqrt(sps)* ...
    rxSig(1:sps*5000), ...
    sps,0);
hold on
scatterplot(rxFilt(1:5000),1,0,'bx',hScatter)
title('Received Signal, Before and After Filtering')
legend('Before Filtering','After Filtering')
axis([-3 3 -3 3]) % Set axis ranges
hold off
References
[1] Korn, Israel, Digital Communications, New York, Van Nostrand Reinhold, 1985.
[2] Oppenheim, Alan V., and Ronald W. Schafer, Discrete-Time Signal Processing, Englewood Cliffs, NJ, Prentice Hall, 1989.
[3] Proakis, John G. Digital Communications. 5th ed. New York: McGraw Hill, 2007.
[4] Rappaport, Theodore S. Wireless Communications: Principles and Practice. Upper Saddle River, NJ: Prentice Hall, 1996.
[5] Sklar, Bernard. Digital Communications: Fundamentals and Applications. Englewood Cliffs, NJ: Prentice-Hall, 1988.
See Also
Functions
Objects
Blocks
Related Topics
You can also select a web site from the following list:
Americas
- América Latina (Español)
- Canada (English)
- United States (English)
Europe
- Belgium (English)
- Denmark (English)
- Deutschland (Deutsch)
- España (Español)
- Finland (English)
- France (Français)
- Ireland (English)
- Italia (Italiano)
- Luxembourg (English)
- Netherlands (English)
- Norway (English)
- Österreich (Deutsch)
- Portugal (English)
- Sweden (English)
- Switzerland
- United Kingdom (English)