Run Polyspace Analysis on Custom Code in C Function Block
You can run a Polyspace® analysis on the custom C code in a C Function (Simulink) block from Simulink®. Polyspace checks the custom C code for errors and bugs while keeping the model specific information such as design range specification, nature and number of inputs that are specified in the Simulink model.
Prerequisites
Before you run Polyspace from Simulink, you must link your Polyspace and MATLAB® installations. See Integrate Polyspace with MATLAB and Simulink.
To open the model used in this example, in the MATLAB Command Window, run:
openExample('polyspace_code_prover/CScriptDemoExample')
open_system('psdemo_model_link_sl_cscript');
Open Model for Running Polyspace Analysis on Custom Code in C Function Block
The model contains a C Function block called Command Strategy inside the controller subsystem.

The Command Strategy block implements a look-up table using custom C code and outputs a value result based on two inputs x and y.
Run Polyspace Analysis
Run Polyspace Analysis from Simulink Editor
Click the Apps tab and select Polyspace Code Verifier to open the Polyspace tab.
Select Bug Finder or Code Prover in the Mode section of the Polyspace tab. A Code Prover analysis detects run-time errors while a Bug Finder analysis detects coding defects and coding rule violations.
To run a Polyspace analysis on the custom C code in the C Function block, select Custom Code Used in Model from the drop-down list in the Analyze section.
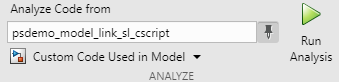
To start the Polyspace analysis, click the Run Analysis button. The MATLAB Command Window displays the progress of the analysis.
After the analysis, the Polyspace Platform user interface opens with the results. if the results do not open after the analysis is finished, click the Analysis Results button.
If you run a Code Prover analysis, the unfiltered results for the controller subsystem contain two red checks and an orange check.
To switch between a Bug Finder and Code Prover analysis, return to the Simulink Editor from the Polyspace Platform user interface. Switch between Bug Finder and Code Prover in the Mode section and run the analysis again.
Run Polyspace Analysis from MATLAB
You can run a Polyspace Code Prover™ analysis on the custom code for this model from MATLAB Editor or the Command Window using this code:
% Load the model 'psdemo_model_link_sl_cscript'
load_system('psdemo_model_link_sl_cscript');
% Create a 'pslinkoptions' object
mlopts = pslinkoptions('psdemo_model_link_sl_cscript');
% Specify whether to run 'CodeProver' or 'BugFinder' Analysis
mlopts.VerificationMode = 'CodeProver';
% Specify custom code as analysis target and run the analysis
pslinkrun('-slcc','psdemo_model_link_sl_cscript',mlopts);
Identify Issues in C Code
To identify issues in the custom C code, use the information in the Result Details pane and the Source pane of the Polyspace Platform user interface. For details on the panes, see Result Details in Polyspace Platform User Interface and Source Code in Polyspace Platform User Interface.
Identify C Function Block Inputs and Outputs in Source Pane
Polyspace wraps the code in the C Function block in a custom code wrapper. The inputs and outputs of the C Function block are declared as global variables. The custom C code is called as a function.
/* Variables corresponding to inputs ..*/
// global In...
/* Variables corresponding to outputs*/
// global Out...
/* Wrapper functions for code in block  */
// void ...(void){
    //...
}
The global variables corresponding to inputs start with
In, such asIn1_psdemo_model_link_sl_cscript_98_Command_strategy.The global variables corresponding to outputs start with
Out, such asOut1_psdemo_model_link_sl_cscript_98_Command_strategy.The
void-voidfunction contains the custom C code with the input and output variables replaced by the global variables. If you have multiple C Function blocks, then the code in each block is wrapped in separate functions.
The global variables reflect the properties of the input and output of the C Function block, including their data range, data type, and size. If you have multiple inputs, then the order of the global variables is the same as the order of the input defined in the C Function block. This table shows the input and output variables of the block in this example and their corresponding global variables in the Source pane.
| Global Variable Name in Source Pane | Scope | Variable Name in C Function Block |
|---|---|---|
In1_psdemo_model_link_sl_cscript_98_Command_strategy | Input | x |
In2_psdemo_model_link_sl_cscript_98_Command_strategy | Input | y |
Out1_psdemo_model_link_sl_cscript_98_Command_strategy | Output | result |
Identify issues in the custom code by reviewing the wrapped code in the Source pane. Use the tooltip in the Source pane and the information in the Result Details pane to fix the issues. This workflow applies to Code Prover and Bug Finder analyses.
Illegally dereferenced pointer
The red check Illegally dereferenced pointer highlights the dereferencing operation after the for loop.
tmp = *p + 5;
*p is outside its bounds. To find the root cause of the check, follow the lifecycle of the pointer leading to the illegal dereferencing.
At the start of its lifecycle, the pointer
*ppoints to the first element ofarraywhich has 100 elements.Then
pis incremented 100 times, pointing*pto the nonexistent locationarray[100].The dereferencing operation in
tmp = *p+5;becomes illegal, causing a red check.
Out of Bounds array index
The red check Out of Bounds array index highlights the array indexing operation in the if condition.
if (another_array[return_val - i + 9] != 0)
another_array is 2 while the index value return_val-i+9 ranges from 2 to 18. To find the root cause of the check, track the values of the variables return_val and i using the tooltip. When you hover over any instance of the variables in the Source pane, the tooltip is displayed.
The value of
iis 100.The value of
return_valranges from 93 to 109 because of the prevailing condition:if ((return_val > 92) && (return_val < 110)).The index value
(return_val-i+9)evaluates to a range of 2 to 18.The index values are out of bounds for the array
another_array, causing a red check.
Overflow
The orange Overflow check highlights the assignment to return_val. The Result Details pane states that the check is related to bounded input values. To find the root cause of the check, check the data type and corresponding range of the variables by using the tooltip.
The input values
xandycorrespond to these respective global variablesIn1_psdemo_model_link_sl_cscript_98_Command_strategyIn2_psdemo_model_link_sl_cscript_98_Command_strategy
The first input
xis an unbound unsigned integer. Becausexis unbound, it has the full range of an unsigned integer, which is from 0 to 65535.The second input
yis a bounded unsigned integer ranging from 0 to 1023.x-yis assigned to the unbound signed integerreturn_val. Becausereturn_valis unbound, it has full range from -32768 to 32767.The range of
x-yis 1023 to 65535, while the range ofreturn_valis -32768 to 32767.Some possible values of
x-ycannot fit intoreturn_val, causing the orange check.
For details about interpreting results of a Polyspace analysis, see Interpret Polyspace Bug Finder Results in Polyspace Platform User Interface.
Fix Identified Issues
Modify the custom C code or the model to fix the issues. You can fix a Polyspace check in several ways. The examples here illustrate the general workflow of fixing Polyspace checks.
Illegally dereferenced pointer
You can address this check in several ways. Modify the C code so that a nonexistent memory address is not accessed.
Return to the Simulink Editor and double-click the C Function block to open the custom code.
Use the index operator on
arrayto access a valid array index. You can access indices from 0 to 99 becausearrayhas 100 elements. Accessing indices beyond this range results in a run-time error in Simulink.Alternatively, assign the address of a valid memory location to// access any index between 0 to 99 tmp = array[50] + 5;
pbefore the dereferencing operation. For example,*pcan point to the 51st element inarray.// After the for loop, point p to a valid memory location p = &(array[50]); // ... tmp = *p + 5;
Out of Bounds array index
You can address this check in several ways. Modify the code so that the size of another_array[] remains larger than or equal to the index value return_val-i+9.
Return to the Simulink Editor and double-click the C Function block to open the custom code.
Modify the prevailing condition on
return_valso that the index valuereturn_val-i+9evaluates to0or1for the possible values ofreturn_val.Alternatively, declareif ((return_val > 91) && (return_val < 93)) //...
another_arraywith size 19.int another_array[19];
Overflow
You can address this check in several ways as well. Modify the C code or the model so that the range of the right side of the assignment operation remains equal to or larger than that of the left side.
Return to the Simulink Editor.
Saturate the input variables
xandyin the model so that their difference can fit into a 16-bit integer. The workflow for fixing Overflow by using saturation blocks is described in Run Polyspace Analysis on Custom Code in C Caller Blocks and Stateflow Charts.
Alternatively, increase the size of return_val in the custom C code to accommodate x-y.
Return to the Simulink Editor and double-click the C Function block to open the custom code.
Declare
return_valas a 32-bit integer.int32_T return_val;
For details about addressing Polyspace results, see Address Polyspace Results Through Bug Fixes or Justifications.