cghfreqplot
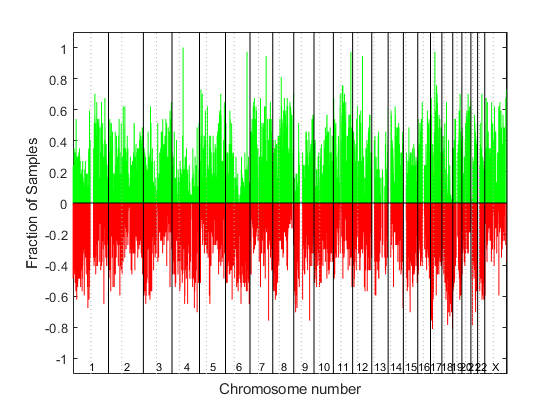
Display frequency of DNA copy number alterations across multiple samples
Syntax
FreqStruct = cghfreqplot(CGHData)


FreqStruct = cghfreqplot(CGHData,
...'Threshold', ThresholdValue, ...)

FreqStruct = cghfreqplot(CGHData,
...'Group', GroupValue, ...)

FreqStruct = cghfreqplot(CGHData,
...'Subgrp', SubgrpValue, ...)

FreqStruct = cghfreqplot(CGHData,
...'Subplot', SubplotValue, ...)

FreqStruct = cghfreqplot(CGHData,
...'Cutoff', CutoffValue, ...)

FreqStruct = cghfreqplot(CGHData,
...'Chromosome', ChromosomeValue, ...)

FreqStruct = cghfreqplot(CGHData,
...'IncludeX', IncludeXValue, ...)

FreqStruct = cghfreqplot(CGHData,
...'IncludeY', IncludeYValue, ...)

FreqStruct = cghfreqplot(CGHData,
...'Chrominfo', ChrominfoValue, ...)

FreqStruct = cghfreqplot(CGHData,
...'ShowCentr', ShowCentrValue, ...)

FreqStruct = cghfreqplot(CGHData,
...'Color', ColorValue, ...)

FreqStruct = cghfreqplot(CGHData,
...'YLim', YLimValue, ...)

FreqStruct = cghfreqplot(CGHData,
...'Titles', TitlesValue, ...)
Input Arguments
CGHData | Array-based comparative genomic hybridization (aCGH) data in either of the following forms:
|
ThresholdValue | Positive scalar or vector that specifies the gain/loss
threshold. A clone is considered to be a gain if its log2 ratio
is above The
Default is |
GroupValue | Specifies the sample groups to calculate the frequency from. Choices are:
Default is a single group of all the samples
in |
SubgrpValue | Controls the analysis of samples by subgroups. Choices are true (default)
or false. |
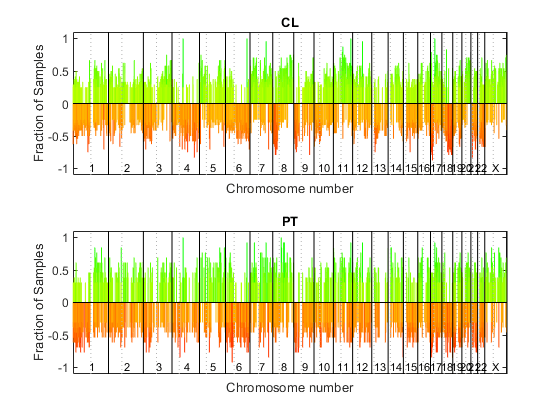
SubplotValue | Controls the display of all plots in one Figure window when
more than one subgroup is analyzed. Choices are true (default)
or false (displays plots in separate windows). |
CutoffValue | Scalar or two-element numeric vector that specifies a cutoff,
which controls the plotting of only the clones with frequency gains
or losses greater than or equal to CutoffValue.
If a two-element vector, the first element is the cutoff for gains,
and the second element is for losses. Default is 0. |
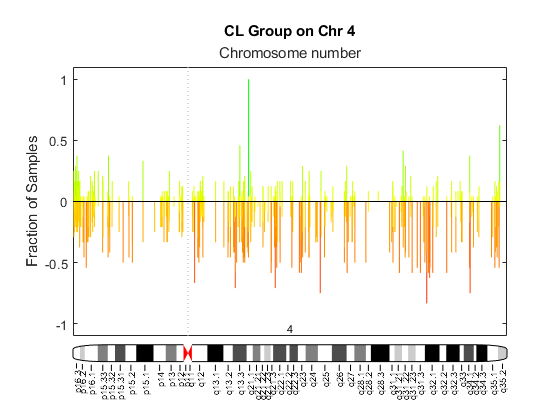
ChromosomeValue | Single chromosome number or a vector of chromosome numbers
that specify the chromosomes for which to display frequency plots.
Default is all chromosomes in CGHData. |
IncludeXValue | Controls the inclusion of the X chromosome in the analysis.
Choices are true (default) or false. |
IncludeYValue | Controls the inclusion of the Y chromosome in the analysis.
Choices are true or false (default)
. |
ChrominfoValue | Cytogenetic banding information specified by either of the following:
Default is Homo sapiens
cytogenetic banding information from the UCSC Genome Browser,
NCBI Build 36.1 ( |
ShowCentrValue | Controls the display of the centromere positions as vertical
dashed lines in the frequency plot. Choices are Tip The centromere positions are obtained from |
ColorValue | Color scheme for the vertical lines in the plot, indicating the frequency of the gains and losses, specified by either of the following:
The default color scheme is a range of colors from pure green (gain = 1) through yellow (0) to pure red (loss = –1). |
YLimValue | Two-element vector specifying the minimum and maximum values
on the vertical axis. Default is [1, -1]. |
TitlesValue | Character vector, string, string vector, or a cell array of character vectors that specifies titles for the group(s), which are added to the tops of the plot(s). |
Output Arguments
FreqStruct | Structure containing frequency data in the following fields:
Tip You can use this output structure as input to the |
Description
FreqStruct = cghfreqplot(CGHData)
FreqStruct = cghfreqplot(CGHData,
...'PropertyName', PropertyValue,
...)cghfreqplot with optional
properties that use property name/property value pairs. You can specify
one or more properties in any order. Each PropertyName must
be enclosed in single quotation marks and is case insensitive. These
property name/property value pairs are as follows:
specifies
the gain/loss threshold. A clone is considered to be a gain if its
log2 ratio is above FreqStruct = cghfreqplot(CGHData,
...'Threshold', ThresholdValue, ...)ThresholdValue,
and a loss if its log2 ratio is below negative ThresholdValue.
The ThresholdValue is applied as
follows:
If a positive scalar, it is the gain and loss threshold for all the samples.
If a two-element vector, the first element is the gain threshold for all samples, and the second element is the loss threshold for all samples.
If a vector of the same length as the number of samples, each element in the vector is considered as a unique gain and loss threshold for each sample.
Default is 0.25.
FreqStruct = cghfreqplot(CGHData,
...'Group', GroupValue, ...)
A vector of sample column indices (for data with only one group). The samples specified in the vector are considered a group.
A cell array of vectors of sample column indices (for data divided into multiple groups). Each element in the cell array is considered a group.
Default is a single group of all the samples in CGHData.
FreqStruct = cghfreqplot(CGHData,
...'Subgrp', SubgrpValue, ...)true (default)
or false.
FreqStruct = cghfreqplot(CGHData,
...'Subplot', SubplotValue, ...)true (default) or false (displays
plots in separate windows).
FreqStruct = cghfreqplot(CGHData,
...'Cutoff', CutoffValue, ...)CutoffValue. CutoffValue is
a scalar or two-element numeric vector. If a two-element numeric vector,
the first element is the cutoff for gains, and the second element
is for losses. Default is 0.
FreqStruct = cghfreqplot(CGHData,
...'Chromosome', ChromosomeValue, ...)ChromosomeValue,
which can be a single chromosome number or a vector of chromosome
numbers. Default is all chromosomes in CGHData.
FreqStruct = cghfreqplot(CGHData,
...'IncludeX', IncludeXValue, ...)true (default)
or false.
FreqStruct = cghfreqplot(CGHData,
...'IncludeY', IncludeYValue, ...)true or false (default).
FreqStruct = cghfreqplot(CGHData,
...'Chrominfo', ChrominfoValue, ...)ChrominfoValue can
be either of the following
Structure returned by the
cytobandreadfunctionCharacter vector or string specifying the file name of an NCBI ideogram text file or a UCSC Genome Browser cytoband text file
Default is Homo sapiens cytogenetic banding information from the UCSC
Genome Browser, NCBI Build 36.1 (https://genome.UCSC.edu).
Tip
You can download files containing cytogenetic G-banding data from the NCBI or UCSC Genome
Browser web site. For example, you can download the cytogenetic banding data
(cytoBandIdeo.txt.gz) for Homo sapiens
from:
FreqStruct = cghfreqplot(CGHData,
...'ShowCentr', ShowCentrValue, ...)true (default)
or false.
Tip
The centromere positions are obtained from ChrominfoValue.
FreqStruct = cghfreqplot(CGHData,
...'Color', ColorValue, ...)
Name of or handle to a function that returns a colormap.
M-by-3 matrix containing RGB values. If M equals 1, then that single color is used for all gains and losses. If M equals 2 or more, then the first row is used for gains, the second row is used for losses, and remaining rows are ignored. For example,
[0
1 0;1 0 0]
specifies green for gain and red for loss.
The default color scheme is a range of colors from pure green (gain = 1) through yellow (0) to pure red (loss = –1).
FreqStruct = cghfreqplot(CGHData,
...'YLim', YLimValue, ...)YLimValue is
a two-element vector specifying the minimum and maximum values on
the vertical axis. Default is [1, -1].
FreqStruct = cghfreqplot(CGHData,
...'Titles', TitlesValue, ...)TitlesValue can be a character vector, string, string
vector, or a cell array of character vectors.
Examples
References
[1] Snijders, A.M., Nowak, N., Segraves, R., Blackwood, S., Brown, N., Conroy, J., Hamilton, G., Hindle, A.K., Huey, B., Kimura, K., Law, S., Myambo, K., Palmer, J., Ylstra, B., Yue, J.P., Gray, J.W., Jain, A.N., Pinkel, D., and Albertson, D.G. (2001). Assembly of microarrays for genome-wide measurement of DNA copy number. Nature Genetics 29, 263–264.
[2] Aguirre, A.J., Brennan, C., Bailey, G., Sinha, R., Feng, B., Leo, C., Zhang, Y., Zhang, J., Gans, J.D., Bardeesy, N., Cauwels, C., Cordon-Cardo, C., Redston, M.S., DePinho, R.A., and Chin, L. (2004). High-resolution characterization of the pancreatic adenocarcinoma genome. PNAS 101, 24, 9067–9072.
Version History
Introduced in R2008a


