Estimate Satellite Battery Charge State Using Satellite Scenario and Eclipse Analysis
This example shows how to estimate satellite battery charge over time using eclipse analysis during a 6-hour mission observing a distant galaxy in the X-ray spectrum. You collect data continuously, downlink it whenever ground access occurs, and charge the battery with solar panels at up to 200 W in sunlight or penumbra. Power consumption is 300 W for data collection, 400 W for downlink, and 10 W for subsystems. The battery stores up to 8.64 MJ, providing 3 hours of backup at 800 W.
Set Up Satellite Scenario
Create a satellite scenario object with a start time of May 6, 2025, 12:00:00 AM UTC, a stop time of May 9, 2025, 12;00:00 AM UTC, and a sample time of 10 seconds. Set AutoSimulate to false.
startTime = datetime(2025,5,6,TimeZone="UTC");
stopTime = datetime(2025,5,9,TimeZone="UTC");
sampleTime = 10; % s
sc = satelliteScenario(startTime,stopTime,sampleTime,AutoSimulate=false);
Add a satellite to the scenario in a circular equatorial orbit with an orbital radius of 10,000 km.
semiMajorAxis = convlength(10000,'km','m'); % m
eccentricity = 0;
inclination = 0;                            % deg
rightAscensionOfAscendingNode = 0;          % deg
argumentOfPeriapsis = 0;                    % deg
trueAnomaly = 0;                            % deg
sat = satellite(sc, ...
    semiMajorAxis, ...
    eccentricity, ...
    inclination, ...
    rightAscensionOfAscendingNode, ...
    argumentOfPeriapsis, ...
    trueAnomaly);
Add a ground station to the scenario.
gs = groundStation(sc);
Add access analysis between the satellite and ground station.
ac = access(sat,gs);
Add eclipse analysis to the satellite.
ecl = eclipse(sat)
ecl =
  Eclipse with properties:

           EclipseModel: "dual-cone"
    IncludeLunarEclipse: 0
Specify the time at which data collection terminates.
dataCollectionCutoff = startTime + hours(6);
Specify the data collection rate.
dataCollectionRate = 20; % MbpsSpecify the downlink rate.
downlinkRate = 10; % MbpsInitialize an array to store the data buffer state and a variable to track the instantaneous state of the data buffer.
dataBufferHistory = zeros(1,seconds(stopTime - startTime)/sampleTime + 1);
dataBufferInstantaneous = 0; % Mb
Initialize arrays to store data collection and downlink status history.
dataCollectionStatusHistory = zeros(1,seconds(stopTime - startTime)/sampleTime + 1);
downlinkStatusHistory = zeros(1,seconds(stopTime - startTime)/sampleTime + 1);
Specify the maximum battery capacity and maximum charging rate.
maxBatEnergy = 800*3600*3; % J
maxChargingRate = 200; % W
Specify the power budgets for downlink and data collection.
downlinkPower = 400; % W
dataCollectionPower = 300; % W
Specify the minimum power consumed by the satellite when not actively collecting or downlinking data.
lowestPowerConsumption = 10; % WInitialize an array to store battery charge state history, set the first value to 80 percent, and create a variable to track the instantaneous charge state.
batEnergyHistory = zeros(1,seconds(stopTime - startTime)/sampleTime + 1);
batEnergyHistory(1) = 0.8*maxBatEnergy;
instantaneousBatEnergy = batEnergyHistory(1);
Simulate Satellite Scenario
Because AutoSimulate is set to false, run the advance function in a loop until SimulationStatus changes to Completed, which indicates SimulationTime has reached StopTime, or until data is collected and fully downlinked. Each iteration advances simulation time by one sample. Initialize the loop counter.
count = 0;
while (sc.SimulationStatus ~= matlabshared.satellitescenario.SimulationStatus.Completed) && ...
        ((sc.SimulationTime < dataCollectionCutoff) || ...
        ((sc.SimulationTime >= dataCollectionCutoff) && dataBufferInstantaneous > 0))
    advance(sc);
Update the loop counter.
count = count + 1;
Retrieve the eclipse status at the current simulation time. When eclipse status is greater than 0, the solar panels can charge the battery.
    eclStatusHistory = eclipseStatus(ecl);
    eclStatus = eclStatusHistory(end);
Retrieve the access status at the current simulation time. The satellite can downlink data to the ground station any time there is access.
    acStatusHistory = accessStatus(ac);
    acStatus = acStatusHistory(end);
Initialize the power consumption level for the current time step.
powerConsumption = lowestPowerConsumption;
If the simulation time is before the data collection cutoff, perform data collection during the current step, increase power consumption accordingly, and update the dataCollectionStatusHistory array.
    if sc.SimulationTime < dataCollectionCutoff
        dataCollectionStatusHistory(count) = 100;
        dataBufferInstantaneous = dataBufferInstantaneous + dataCollectionRate*sampleTime;
        powerConsumption = powerConsumption + dataCollectionPower;
    end
When ground access is available, downlink data from the buffer, increase power consumption accordingly, and update the downlinkStatusHistory array.
    if acStatus
        downlinkStatusHistory(count) = 100;
        dataBufferInstantaneous = max(dataBufferInstantaneous - downlinkRate*sampleTime, 0);
        powerConsumption = powerConsumption + downlinkPower;
    end
When the Sun is visible, which is the case when eclipse status is greater than 0, the solar panels produce power to charge the battery. Calculate the charging rate based on the eclipse status value.
chargingRate = eclStatus*maxChargingRate;
Calculate the instantaneous battery state at this time step.
    instantaneousBatEnergy = max(min(maxBatEnergy, ...
        instantaneousBatEnergy + (chargingRate - powerConsumption)*sampleTime), 0);
Update the arrays that store battery and data buffer state histories.
    batEnergyHistory(count) = instantaneousBatEnergy;
    dataBufferHistory(count) = dataBufferInstantaneous;
end
Plot Battery Charge State
Retrieve the access status, eclipse status and eclipse type histories.
[acStatus, times] = accessStatus(ac);
[eclStatus, ~, eclType] = eclipseStatus(ecl);
Plot the battery charge state history and annotate eclipse periods. Mark the data collection and downlink windows.
batEnergyPercentHistory = batEnergyHistory(1:count)*100/maxBatEnergy;
penumbra = eclType == Aero.satellitescenario.EclipseType.Penumbra;
umbra = eclType == Aero.satellitescenario.EclipseType.Umbra;
batEnergyPercentHistoryDuringPenumbra = batEnergyPercentHistory.*penumbra;
batEnergyPercentHistoryDuringPenumbra(batEnergyPercentHistoryDuringPenumbra == 0) = NaN;
batEnergyPercentHistoryDuringUmbra = batEnergyPercentHistory.*umbra;
batEnergyPercentHistoryDuringUmbra(batEnergyPercentHistoryDuringUmbra == 0) = NaN;
plot(times,batEnergyPercentHistory,'-g', ...
    times,batEnergyPercentHistoryDuringPenumbra,'-b', ...
    times,batEnergyPercentHistoryDuringUmbra,'-r', ...
    LineWidth=2);
hold on
area(times,dataCollectionStatusHistory(1:count),FaceColor='magenta',FaceAlpha=0.5,EdgeColor='magenta',EdgeAlpha=0.5);
area(times,downlinkStatusHistory(1:count),FaceColor='cyan',FaceAlpha=0.5,EdgeColor='cyan',EdgeAlpha=0.5);
ylim([0 100]);
grid on;
xlabel('Time');
ylabel('Battery charge percentage');
legend('Sunlight','Penumbra','Umbra','Data collection window','Downlink window',Location='southeast');
hold off
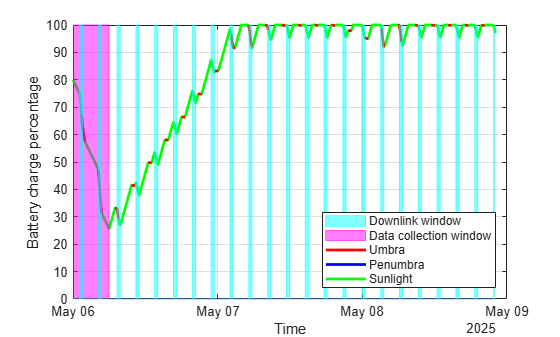
The charge state starts at 80 percent. Because the 200 W charging rate is lower than the 300 W for data collection and 400 W for downlink, the charge decreases whenever either operation occurs, even in sunlight. During the 6-hour data collection period, the charge continuously drops. After data collection ends, the battery recharges whenever sunlight is available and no downlink is active.
See Also
eclipse | access | groundStation