Australian National University Researchers Create 3D Views of Blood Clot Formation
“MATLAB has a unique combination of capabilities that lets us interface with hardware, tap into powerful image processing functions, and create easy-to-use graphical interfaces for biologists. These MATLAB capabilities enable us to rapidly deliver new and better versions of our software.”
Challenge
Create 3D images of blot clots as they form using data from a digital holographic microscope
Solution
Use MATLAB to acquire image data, develop image processing algorithms, and package the algorithms as a standalone application
Results
- Sample analysis time reduced from days to hours
- Development time reduced by months
- Research tools and resources readily accessible
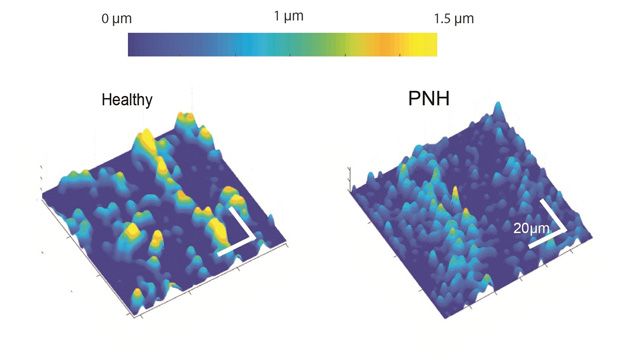
Results showing healthy platelets and those with paroxysmal nocturnal hemoglobinuria (PNH).
Physicians know that an undetected unstable blood clot (thrombosis) can lead to a stroke or heart attack, but predicting such unstable clots at a microscopic level is a challenge. Clot formation is a highly dynamic process involving interactions between micron-sized blood platelets that vary in size, function, and density even within a single clot.
A group of optical engineers and biochemists at Australian National University (ANU) has developed a bio-optics device that enables biologists to create 3D views of clots on a microscopic scale as the clots form. Images from the device are processed by an application that produces an optical digital hologram of clot formation where precise measurements of the time required for light to travel through the clot is acquired in real time. By accurately capturing the delay time of light from the digital hologram through a sequence of numerical steps, it is possible to reconstruct 3D images directly. The team used MATLAB® based software to implement this process. They created a standalone toolbox for image processing that biologists can use to observe the functional properties of platelets as a clot forms in real time, enabling earlier and more accurate predictions of thrombosis.
“At the end of the day, what’s important is the ability to generate outcomes faster, and MATLAB lets us do that,” says Dr. Woei Ming (Steve) Lee, research group leader at ANU. “MATLAB enables us to move quickly from idea to working software.”
Challenge
The ANU group uses a digital holographic microscope (DHM) that includes a laser, several mirror scanners, and a charge-coupled device camera. The camera captures images of blood sample holograms as the samples pass through a micro-fabricated device designed to mimic a damaged blood vessel. The ANU team needed to develop software that acquired camera data, produced a holographic image from the data, and presented the results via an interface that biologists without programming experience could use.
Clot size and the speed of clot formation vary significantly from patient to patient. This meant that the team needed to use an iterative approach to software development that would make it easy to adjust the algorithm and troubleshoot edge cases.
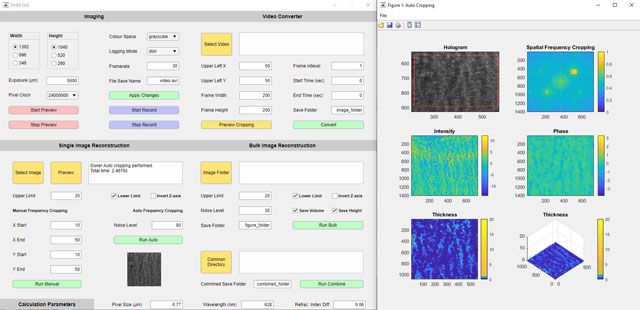
A standalone user interface, developed by the ANU team in MATLAB, that enables biologists to tune processing parameters and view results.
Solution
Dr. Lee and his team used MATLAB to develop the image processing and analysis software for producing real-time digital holograms of blood clots as they form.
The team wrote MATLAB scripts to automate the acquisition of image data from the DHM camera with Image Acquisition Toolbox™ at up to 50 frames per second.
Working in MATLAB with Image Processing Toolbox™, the team first developed an adaptive filtering algorithm that applies a fast Fourier transform (FFT) to retrieve phase information from the camera data. The algorithm determines the size, center, and boundaries of objects in the captured images and computes a global threshold level, which it uses to convert the intensity image to a binary image.
After applying a filter and an inverse FFT, the algorithm uses a corrective mask to compensate for optical distortions in the system. It then performs a convolution to remove noise and improve the clarity of the final image.
The team developed a user interface in MATLAB to enable biologists to interactively tune processing parameters and view results. Using MATLAB Compiler™, they packaged the interface and algorithm as a standalone application that can be used without installing MATLAB.
Experiments with three DHM setups and accompanying MATLAB software are currently running in the ANU lab. Meanwhile, the team is working on a super-resolution version of the microscope that will make it possible to capture nanoscale holograms of platelets during in vitro blood clot formation.
Results
- Sample analysis time reduced from days to hours. “Our process requires processing thousands of images—multiple gigabytes of data—for a single sample,” says Dr. Lee. “MATLAB enabled us to cut processing time for this data from days to hours by implementing a streamlined workflow in which we calibrate flow rates and other parameters before processing the data as a batch.”
- Development time reduced by months. “On a project we just completed, the user interface took us six months because we were required to develop it in C,” Dr. Lee says. “With MATLAB, a similar interface would take half a day.”
- Research tools and resources readily accessible. “Because ANU has a Campus-Wide License, most of our students have experience with MATLAB,” says Dr. Lee. “The ability to draw on that pool of technical proficiency, combined with access to the latest version of MATLAB and its toolboxes, is a big advantage for our program.”
Select a Web Site
Choose a web site to get translated content where available and see local events and offers. Based on your location, we recommend that you select: United States.
You can also select a web site from the following list
Americas
- América Latina (Español)
- Canada (English)
- United States (English)
Europe
- Belgium (English)
- Denmark (English)
- Deutschland (Deutsch)
- España (Español)
- Finland (English)
- France (Français)
- Ireland (English)
- Italia (Italiano)
- Luxembourg (English)
- Netherlands (English)
- Norway (English)
- Österreich (Deutsch)
- Portugal (English)
- Sweden (English)
- Switzerland
- United Kingdom (English)