mavolcanoplot
Create significance versus gene expression ratio (fold change) scatter plot of microarray data
Syntax
mavolcanoplot(DataX, DataY,
PValues)

SigStructure = mavolcanoplot(DataX, DataY, PValues)


... mavolcanoplot(..., 'Labels', LabelsValue,
...)

... mavolcanoplot(..., 'LogTrans', LogTransValue,
...)

... mavolcanoplot(..., 'PCutoff', PCutoffValue, ...)

... mavolcanoplot(..., 'Foldchange', FoldchangeValue,
...)

... mavolcanoplot(..., 'PlotOnly', PlotOnlyValue,
...)
Input Arguments
DataX, DataY | DataMatrix object, matrix, or vector of gene expression values from a single experimental condition. If a DataMatrix object or a matrix, each row is a gene, each column is a sample, and an average expression value is calculated for each gene. Note If the values in |
PValues | Either of the following:
|
LabelsValue | Cell array of character vectors or string vector containing labels (typically gene
names or probe set IDs) for the data. After creating the plot, you
can click a data point to display the label associated with it. If
you do not provide a |
LogTransValue | Property to control the conversion of data in |
PCutoffValue | Lets you specify a cutoff p-value to define data points that are statistically
significant. This value is displayed graphically as a horizontal
line on the plot. Default is Note You can also change the p-value cutoff interactively after creating the plot. |
FoldchangeValue | Lets you specify a ratio fold change to define data points
that are differentially expressed. Default is Note You can also change the fold change interactively after creating the plot. |
PlotOnlyValue | Controls the display of the volcano plot without user
interface components. Choices are Note If you set the |
Output Arguments
SigStructure | Structure containing information for genes that are considered to be both statistically significant (above the p-value cutoff) and significantly differentially expressed (outside of the fold change values). The fields are listed below. |
Description
mavolcanoplot( creates a
scatter plot of gene expression data, plotting significance versus fold change of gene
expression ratios of two data sets, DataX, DataY,
PValues)DataX and
DataY. It plots significance as the
–log10 (p-value) from the input,
PValues. DataX and
DataY can be vectors, matrices, or DataMatrix objects.
PValues is a column vector or DataMatrix object.
SigStructure = mavolcanoplot(DataX, DataY, PValues)SigStructure are
sorted by p-value and include:
NamePCutoffFCThresholdGeneLabelsPValuesFoldChanges
Note
The fields PValues and FoldChanges will
be either vectors or DataMatrix objects depending on the type of input PValues.
... mavolcanoplot(..., ' defines optional properties that use property name/value
pairs in any order. These property name/value pairs are as follows:PropertyName', PropertyValue,
...)
... mavolcanoplot(..., 'Labels',
lets you provide a cell array of character vectors or string vector containing labels
(typically gene names or probe set IDs) for the data. After creating the plot, you can
click a data point to display the label associated with it. If you do not provide a
LabelsValue,
...)LabelsValue, data points are labeled with row numbers
from DataX and DataY.
... mavolcanoplot(..., 'LogTrans', controls the conversion of data from LogTransValue,
...)DataX and DataY to
log2 scale. When LogTransValue is true, mavolcanoplot converts
data from natural to log2 scale. Default is false,
which assumes the data is already log2 scale.
... mavolcanoplot(..., 'PCutoff', lets you specify a p-value cutoff
to define data points that are statistically significant. This value
displays graphically as a horizontal line on the plot. Default is PCutoffValue, ...)0.05,
which is equivalent to 1.3010 on the –log10 (p-value)
scale.
Note
You can also change the p-value cutoff interactively after creating the plot.
... mavolcanoplot(..., 'Foldchange', lets you specify a ratio fold change to
define data points that are differentially expressed. Fold changes
display graphically as two vertical lines on the plot. Default is FoldchangeValue,
...)2,
which corresponds to a ratio of 1 and –1 on a log2 (ratio)
scale.
Note
You can also change the fold change interactively after creating the plot.
... mavolcanoplot(..., 'PlotOnly', controls the display of the volcano plot
without user interface components. Choices are PlotOnlyValue,
...)true or false (default).
Note
If you set the 'PlotOnly' property to true,
you can still display labels for data points by clicking a data point,
and you can still adjust vertical fold change lines and the horizontal
p-value cutoff line by click-dragging the lines.
The volcano plot displays the following:
–log10 (p-value) versus log2 (ratio) scatter plot of genes
Two vertical fold change lines at a fold change level of 2, which corresponds to a ratio of 1 and –1 on a log2 (ratio) scale. (Lines will be at different fold change levels, if you used the
'Foldchange'property.)One horizontal line at the 0.05 p-value level, which is equivalent to 1.3010 on the –log10 (p-value) scale. (The line will be at a different p-value level, if you used the
'PCutoff'property.)
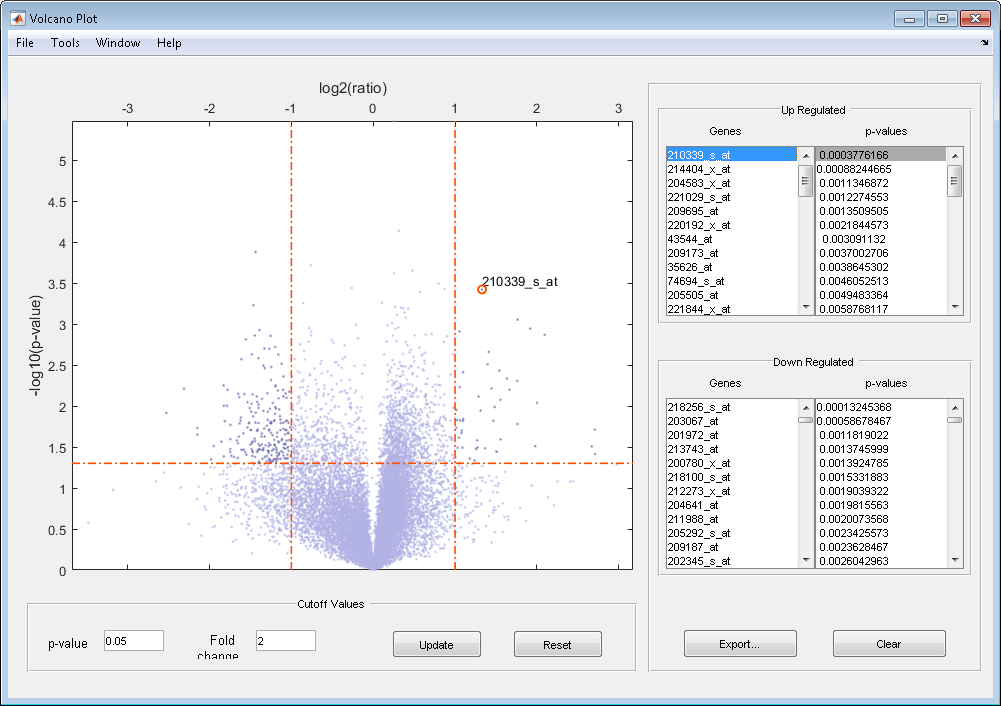
After you display the volcano scatter plot, you can interactively:
Adjust the vertical fold change lines by click-dragging one line or entering a value in the Fold Change text box.
Adjust the horizontal p-value cutoff line by click-dragging or entering a value in the p-value Cutoff text box.
Display labels for data points by clicking a data point.
Select a gene from the Up Regulated or Down Regulated list to highlight the corresponding data point in the plot. Press and hold Ctrl or Shift to select multiple genes.
Zoom the plot by selecting Tools > Zoom In or Tools > Zoom Out.
View lists of significantly up-regulated and down-regulated genes and their associated p-values, and optionally, export the labels, p-values, and fold changes to a structure in the MATLAB® Workspace by clicking Export.
Examples
Load a MAT-file, included with the Bioinformatics Toolbox™ software, which contains Affymetrix® data variables, including
dependentDataandindependentData, two matrices of gene expression values from two experimental conditions.load prostatecancerexpdataUse the
mattestfunction to calculate p-values for the gene expression values in the two matrices.pvalues = mattest(dependentData, independentData);
Using the two matrices, the
pvaluescalculated bymattest, and theprobesetIDscolumn vector of labels provided, usemavolcanoplotto create a significance versus gene expression ratio scatter plot of the microarray data from the two experimental conditions.mavolcanoplot(dependentData, independentData, pvalues,... 'Labels', probesetIDs)
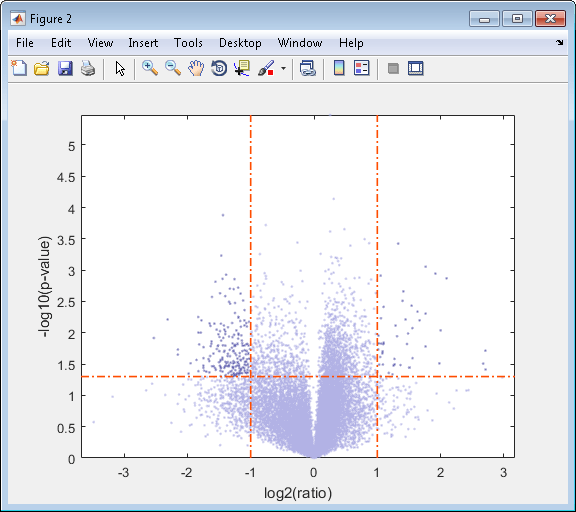
View the volcano plot without the user interface components.
mavolcanoplot(dependentData, independentData, pvalues,...
'Labels', probesetIDs,'Plotonly', true)
The prostatecancerexpdata.mat file used in
the previous example contains data from Best et al., 2005.
References
[1] Cui, X., Churchill, G.A. (2003). Statistical tests for differential expression in cDNA microarray experiments. Genome Biology 4, 210.
[2] Best, C.J.M., Gillespie, J.W., Yi, Y., Chandramouli, G.V.R., Perlmutter, M.A., Gathright, Y., Erickson, H.S., Georgevich, L., Tangrea, M.A., Duray, P.H., Gonzalez, S., Velasco, A., Linehan, W.M., Matusik, R.J., Price, D.K., Figg, W.D., Emmert-Buck, M.R., and Chuaqui, R.F. (2005). Molecular alterations in primary prostate cancer after androgen ablation therapy. Clinical Cancer Research 11, 6823–6834.
Version History
Introduced in R2006a
You can also select a web site from the following list:
Americas
- América Latina (Español)
- Canada (English)
- United States (English)
Europe
- Belgium (English)
- Denmark (English)
- Deutschland (Deutsch)
- España (Español)
- Finland (English)
- France (Français)
- Ireland (English)
- Italia (Italiano)
- Luxembourg (English)
- Netherlands (English)
- Norway (English)
- Österreich (Deutsch)
- Portugal (English)
- Sweden (English)
- Switzerland
- United Kingdom (English)